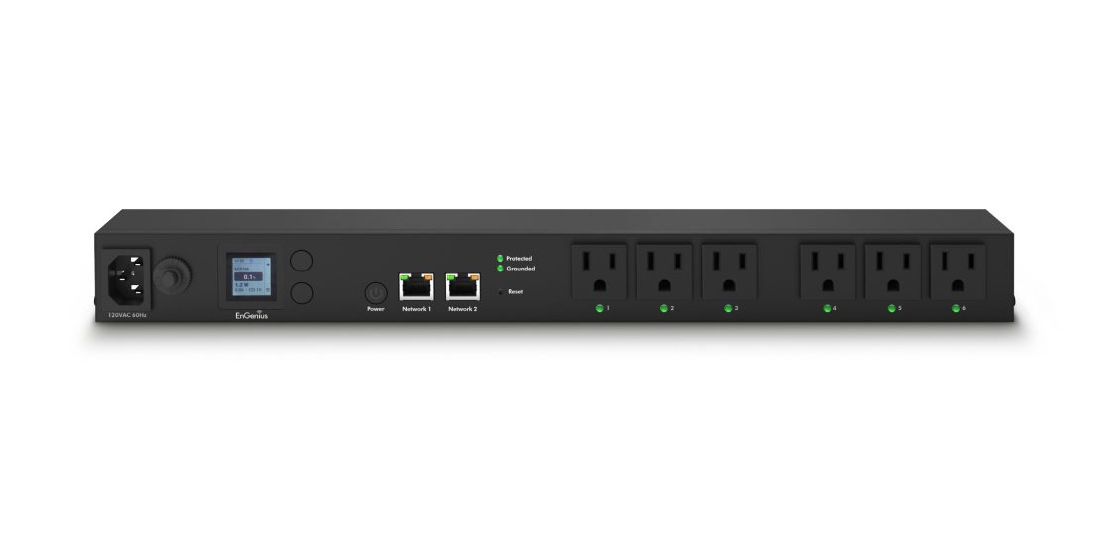
EnGenius ECP106 PDU
Photo by EnGenius from engeniustech.com
Table of Contents
After trying out some of the EnGenius wireless APs and switches, EnGenius sent me their ECP106 PDU so I could take a closer look. I thought reviewing a PDU would be interesting since I had not yet had the opportunity to do so.
A PDU is a power distribution unit – essentially it is a power strip. Many PDUs offer surge protection and can be rack mountable so you can power all of your rack mounted devices. Once you start building out your homelab like I have over the years, you will find that you cannot have too many power outlets. Since I have starting reviewing hardware, my need for more outlets has increased.
The EnGenius ECP106 is a cloud managed smart PDU which means it has much more functionality than a basic PDU that only provides power and surge protection.
Even though the PDU is marketed as a cloud managed PDU, there is a standalone web interface you may use instead. I am glad it has a standalone interface because you can still manage the device even when you Internet is down. Also if for some reason the EnGenius company folds, you are not stuck with a device that you can no longer manage because the cloud infrastructure was shut down.
Unboxing
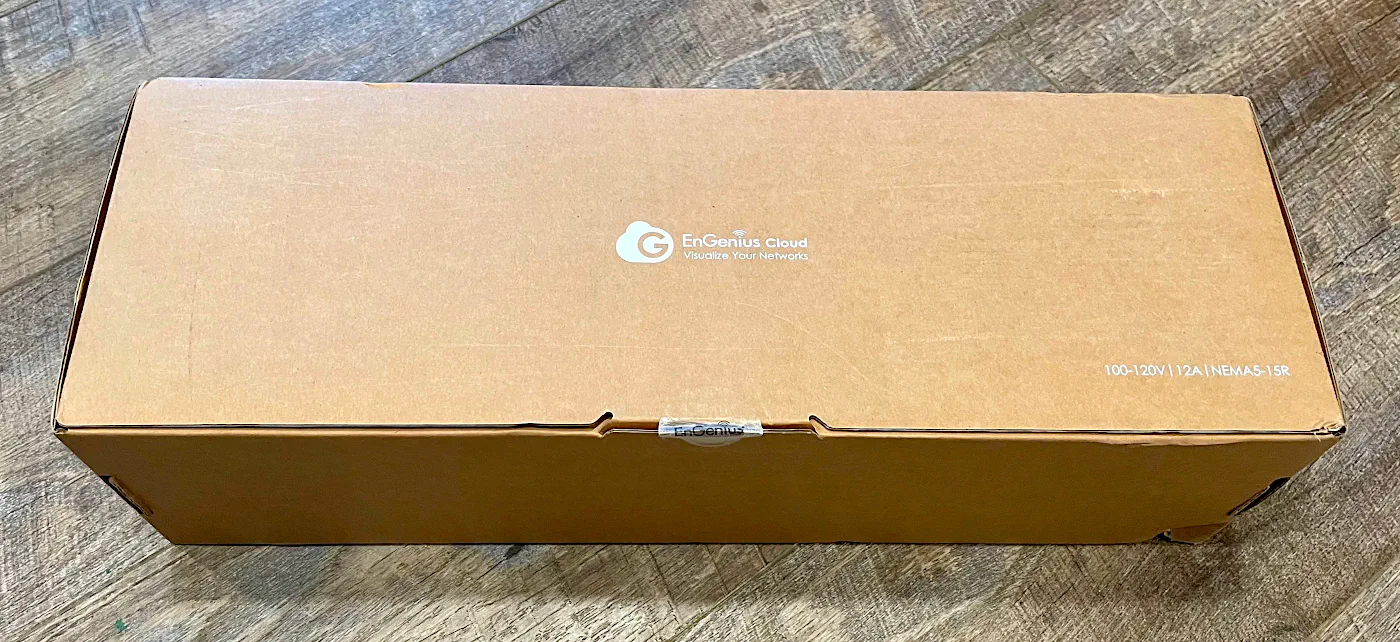
The ECP106 PDU comes in a nicely labeled and packed box.
I took a picture of the foam packaging to show how well protected it is from damage that might occur during shipping.
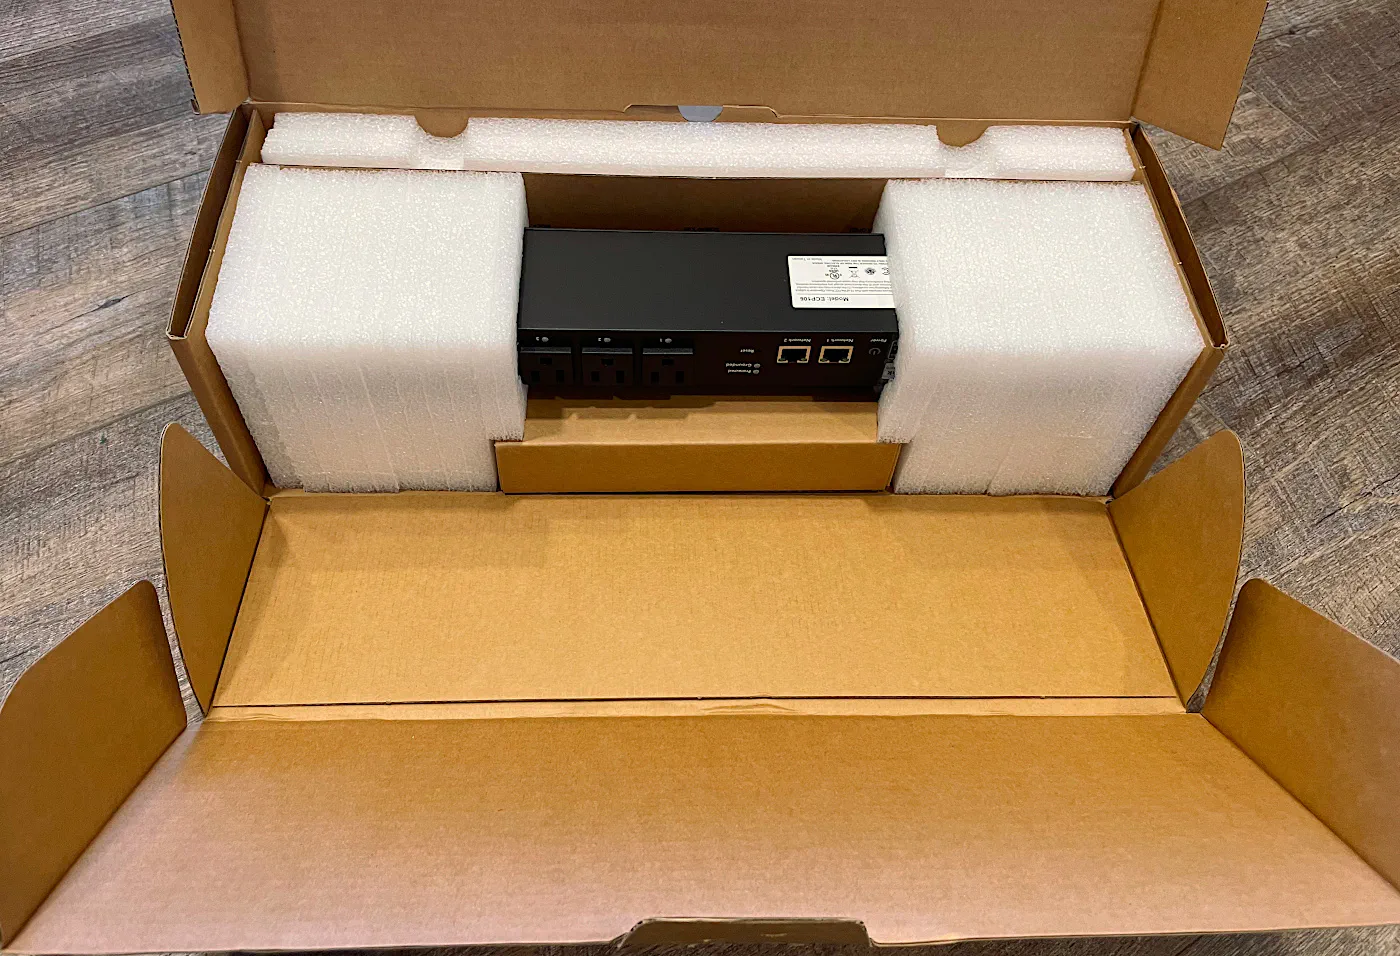
The hardware was also packaged nicely on one side of the box.
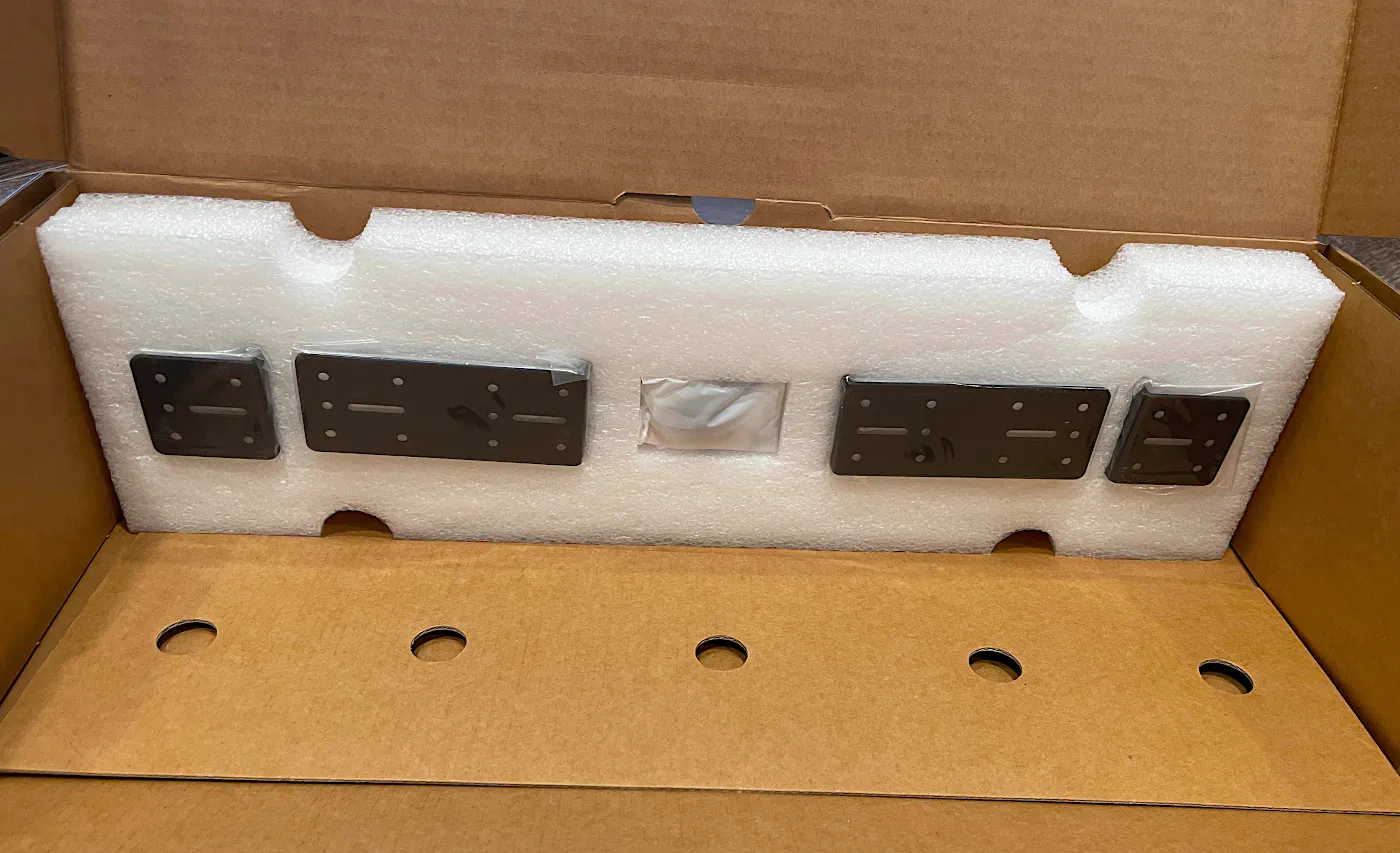
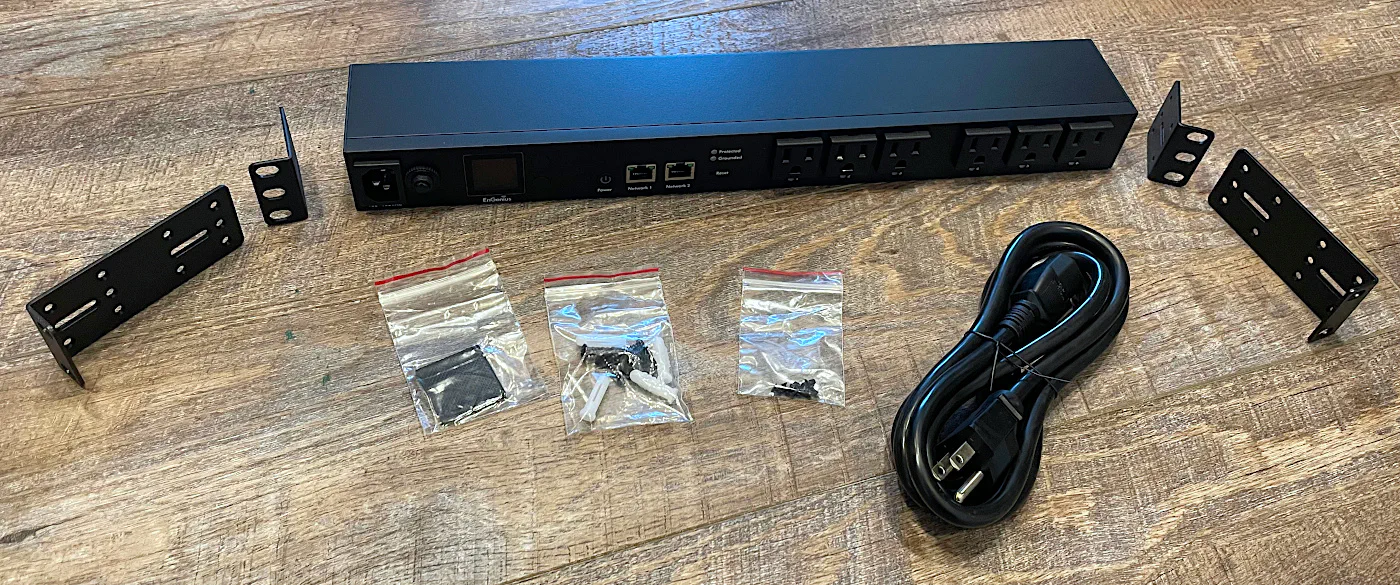
Along with the PDU, you receive 2 sets of rack years. One set is the standard rackmount ears you find on most rackmount equipment but the other set is essentially a 2U version that you could use to mount 2 devices together.
You also receive a nice thick power cord, rubber pads for the bottom of the PDU if not rack mounting, screws for the rackmount ears, and mounting hardware if you wish to mount the PDU under a desk or on a wall.
Build Quality
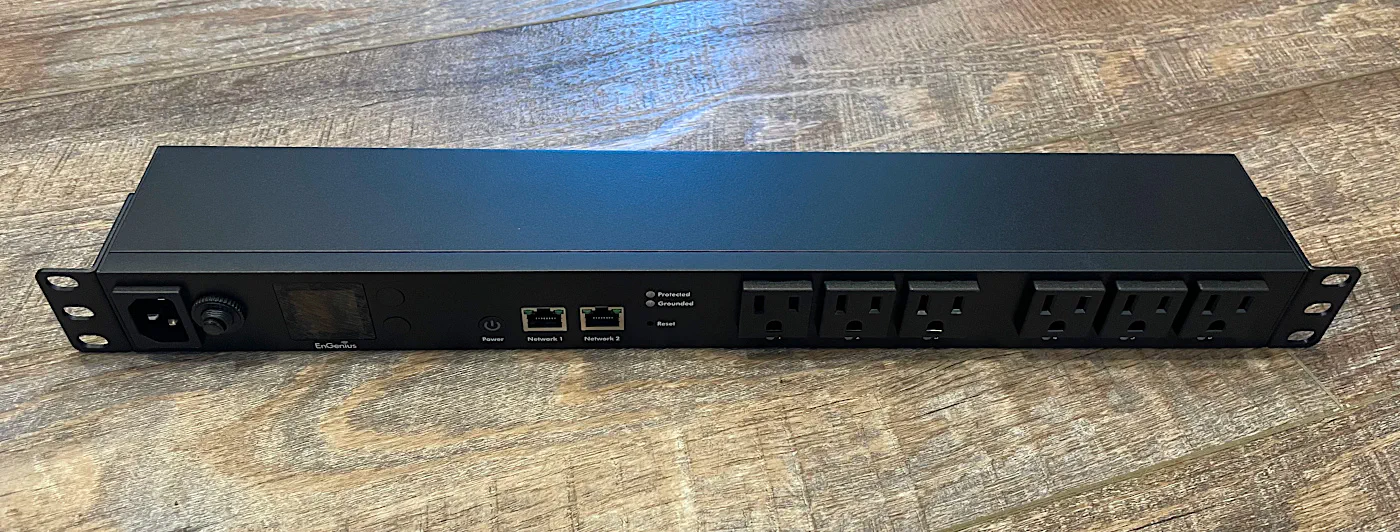
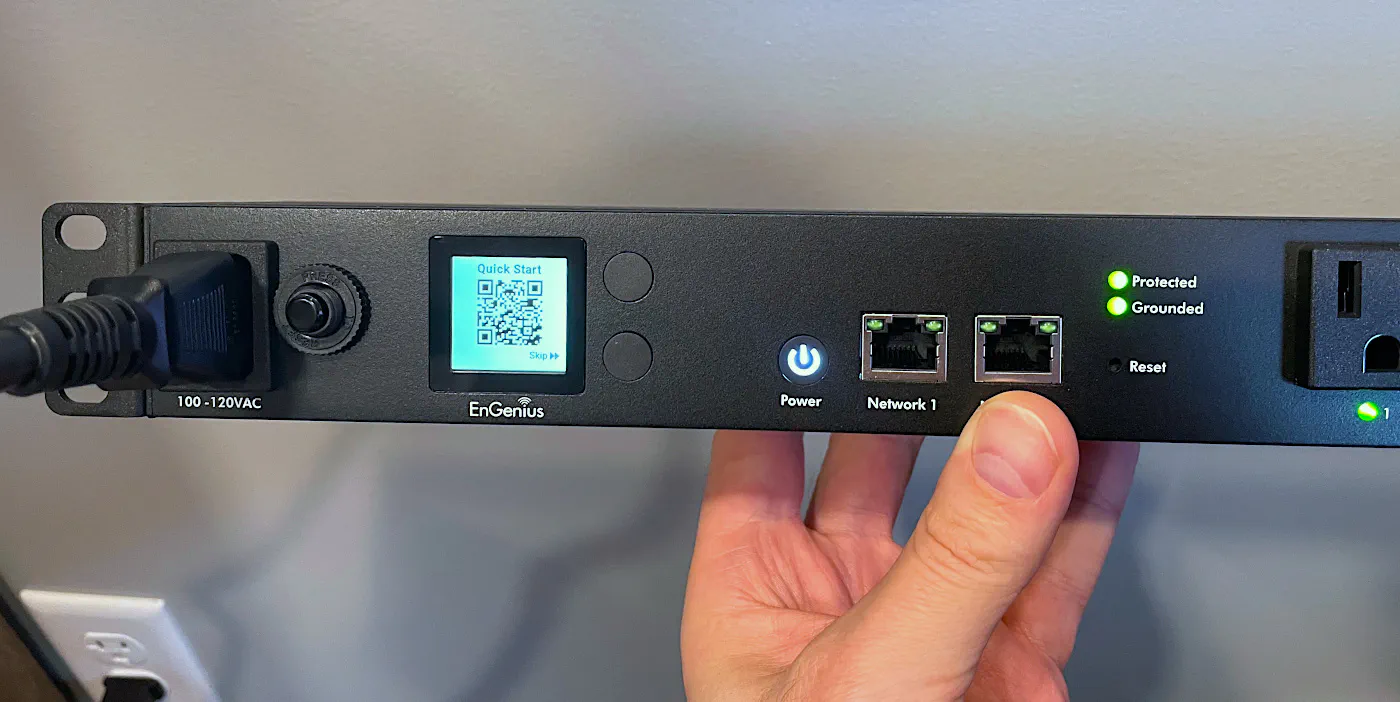
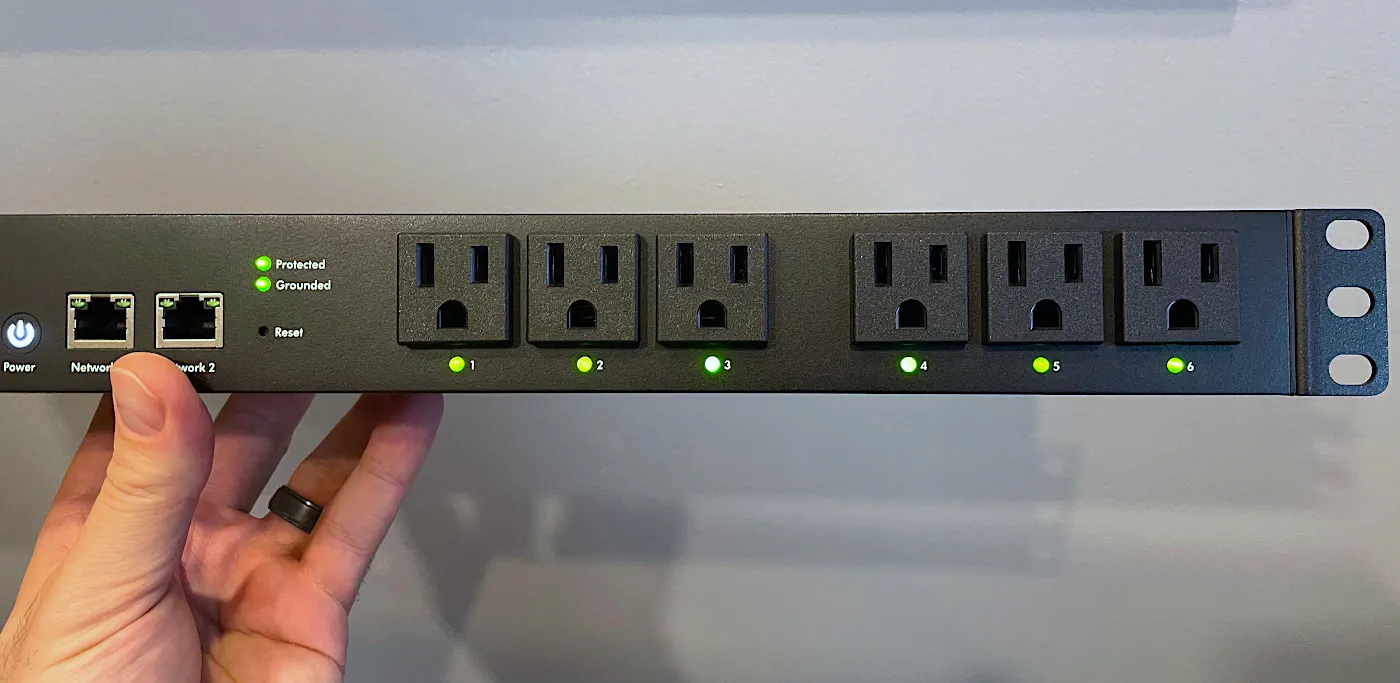
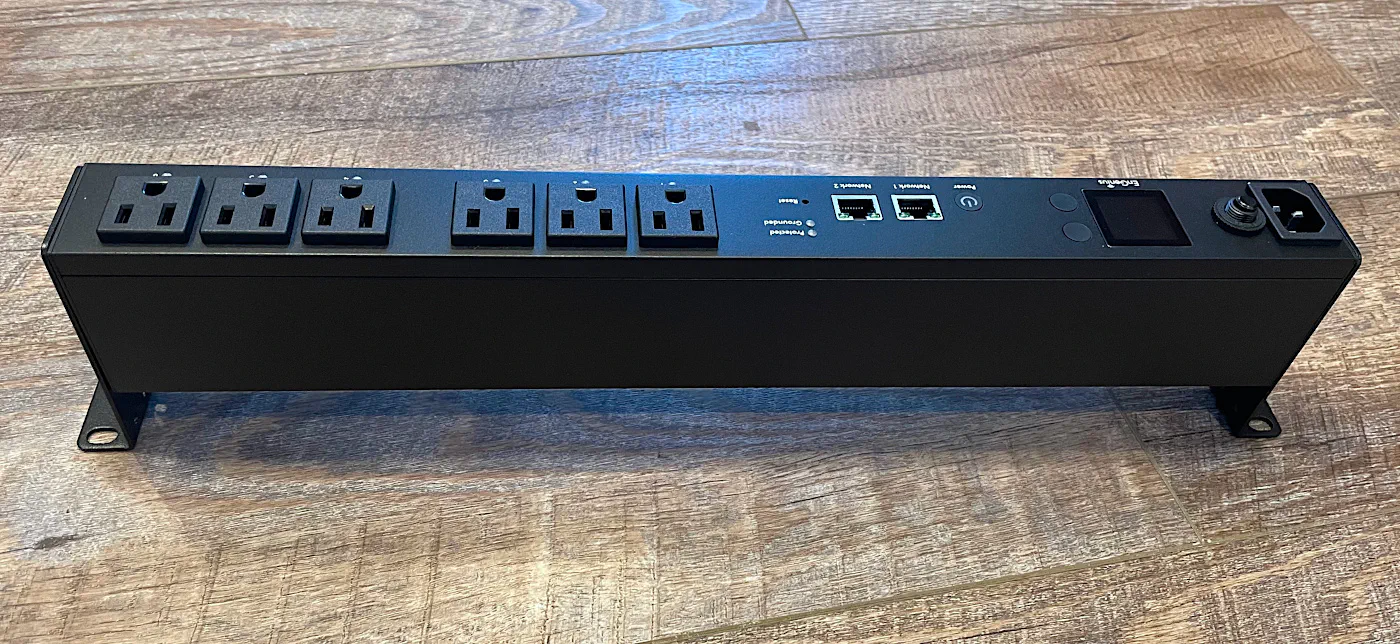
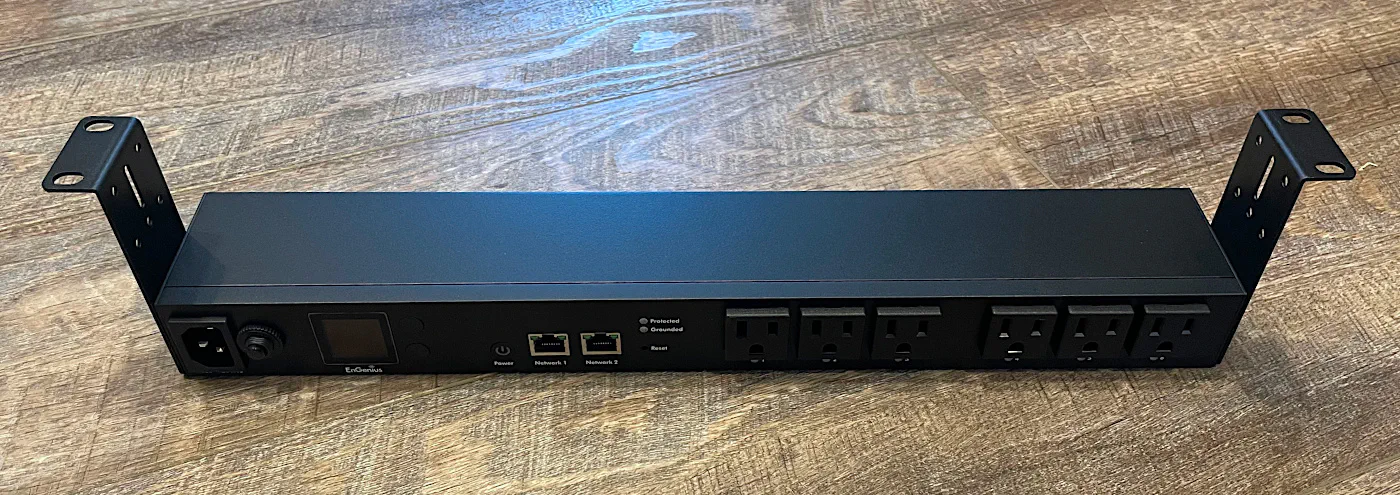
When you take out the PDU, you can tell it feels heavier duty than a cheaply made PDU. I have one very cheap PDU in my rack as a reference point. You will see that it as a small display, power button, 2 Ethernet jacks, a factory reset button, 2 status LEDs, and 6 outlets.
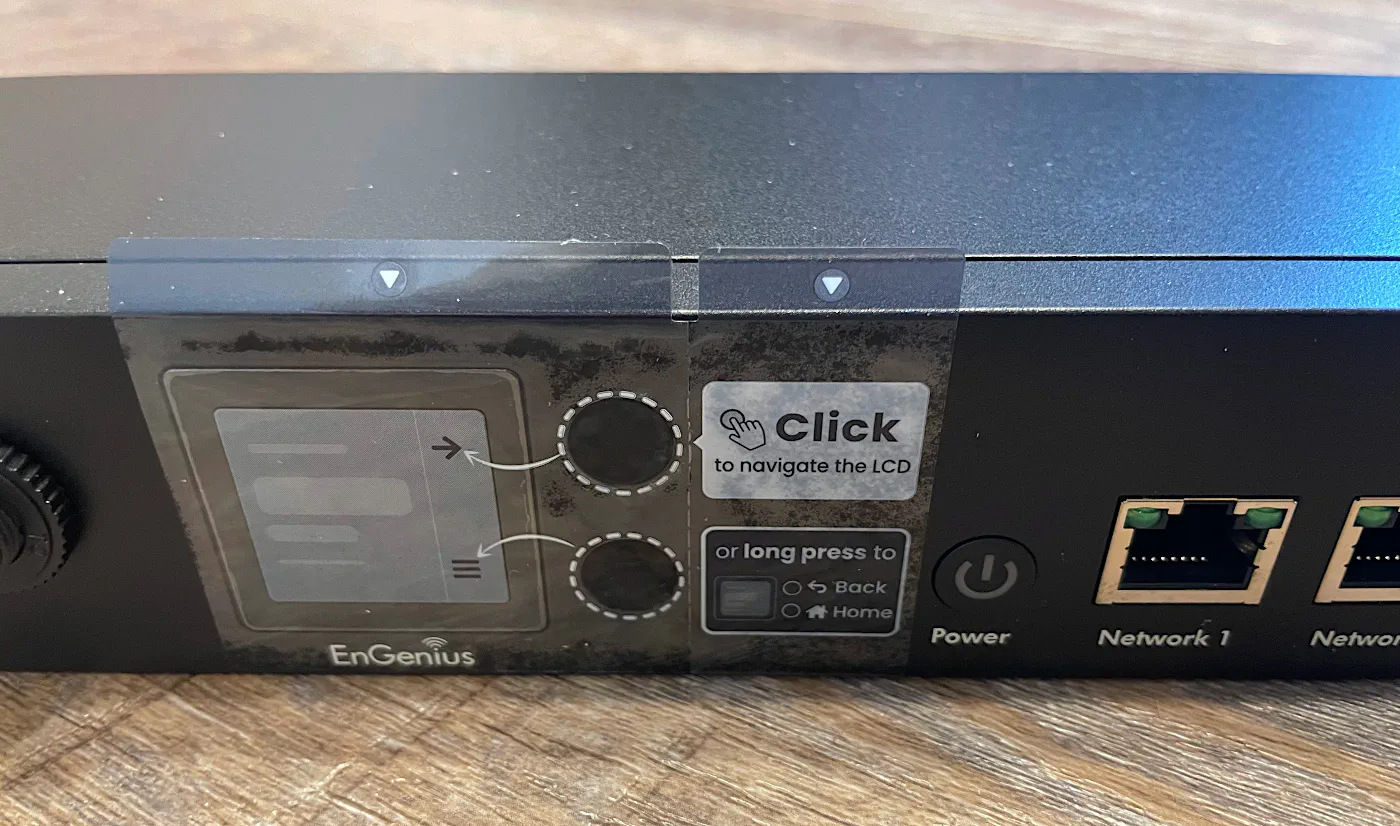
Below is a closer look at the display screen. I left the stickers on it so you can see the instructions for how to use the buttons. You can press the buttons to navigate the menus use a long press to go back or to home.
When the PDU is powered for the first time, it will show a QR code so you can quickly add it to your cloud account if you wish to cloud manage the device. The QR code is also located on the bottom of the PDU.
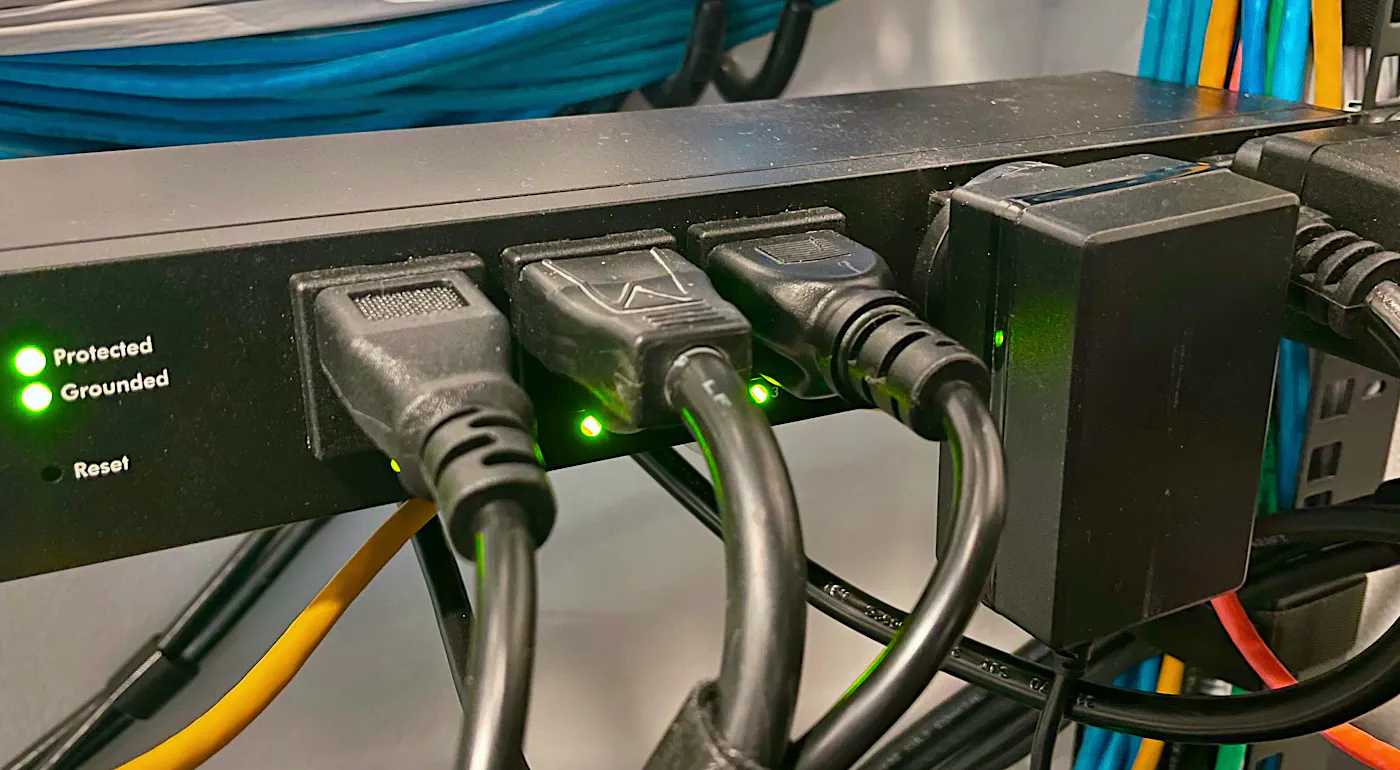
You can see the “Protected” and “Grounded” status LEDs lit up as well as the LEDs for each of the outlets to indicate they are powered on.
Features
Since this unit is a smart PDU, there are several notable features to discuss.
Power Monitoring
Power monitoring is always a great feature for tracking energy usage of your electronics and other appliances in your home. Being able to see the usage per outlet is useful for determining which devices are consuming the most amount of energy. In some parts of the world, energy is more costly so minimizing energy consumption is an important consideration. Also, you may be concerned with being as green as possible so being able to monitor consumption is essential.
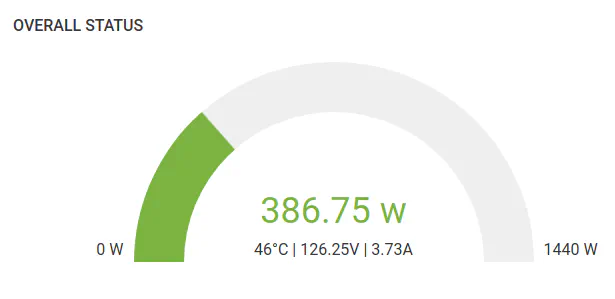
You may view the power usage on the display on the PDU as well as the local/cloud web interfaces and mobile app. If you have a Pro subscription, I imagine you would be able to get the power consumption values from the RESTful API.
Remote Power On/Off
Because this is a smart PDU that has management capabilities, you have the ability to remotely power on and off outlets via the local/cloud web interfaces and mobile app.
For home users, this feature may be beneficial if your equipment if you would like to control your devices anywhere inside your home or while you are away from home.
Power On/Off Schedules
If you would like to set power on and off schedules, you have the ability to do so with this PDU. Perhaps this could be one way to save power at night when you are not using certain devices or on the weekends for businesses which are closed.
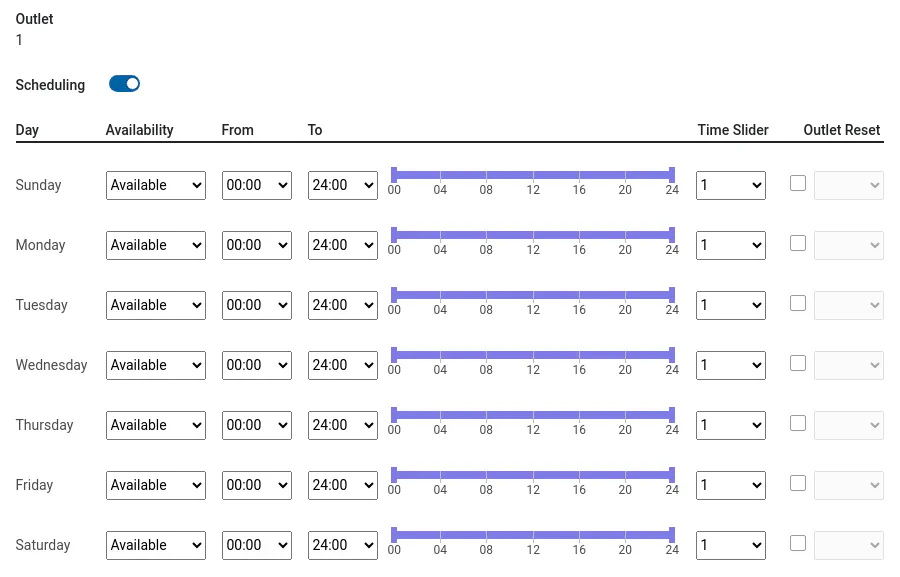
Networking equipment would likely be ok if you turned off the power abruptly, but if you are using power schedules for PCs or servers, for example, you might want to exercise caution since you risk corrupting files or the filesystem by shutting off the power.
1.3" Display
On the front of the PDU, you will see the 1.3 inch display. This display shows the overall power statistics as well as the statistics for each individual outlet.
When you first boot up the PDU, it will present a QR code to make it easier to add it to your cloud account.

The screen is a convenient way to get a quick glance of the power statistics without needing to open a mobile app or web interface especially if you are already near your server rack performance maintenance or upgrades.
Power Reports
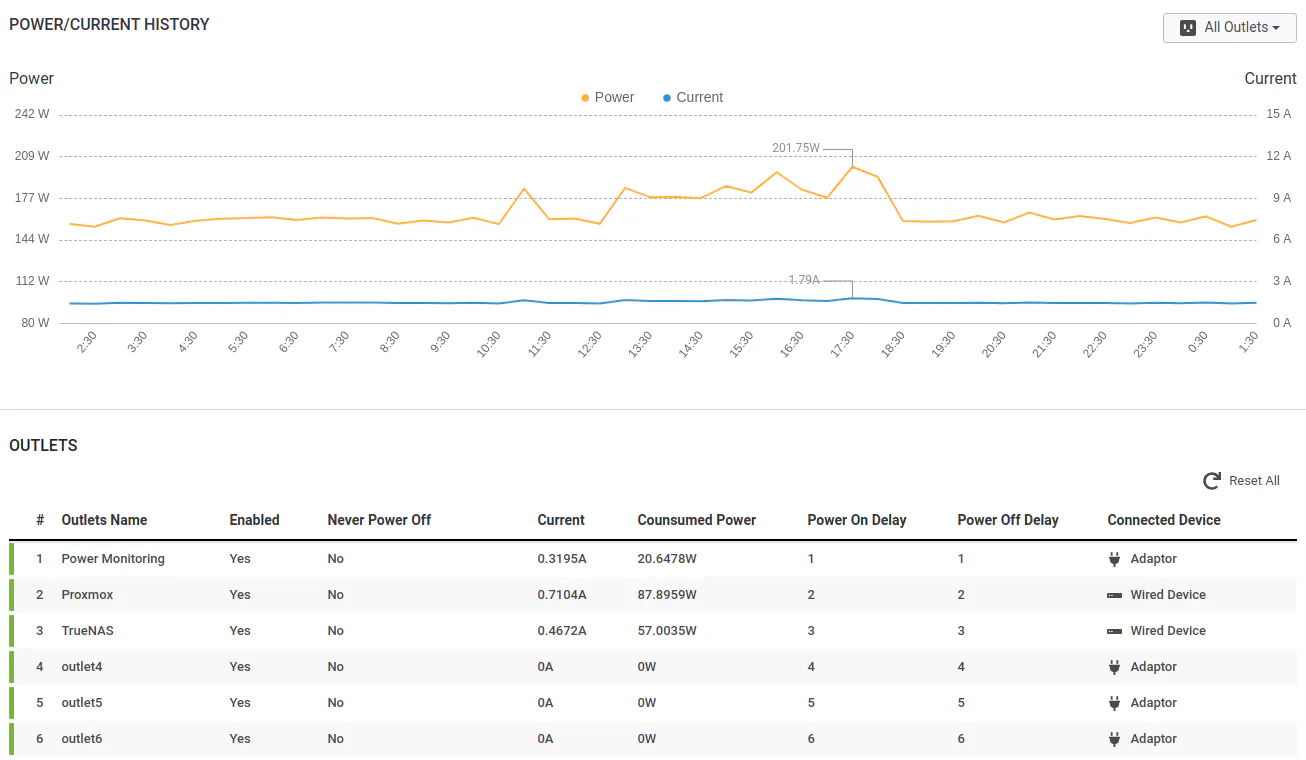
In addition to the overall power meter dial, the web UIs provide a nice chart showing power usage over the last 24 hours. The chart labels the peak wattage and amperage as well.
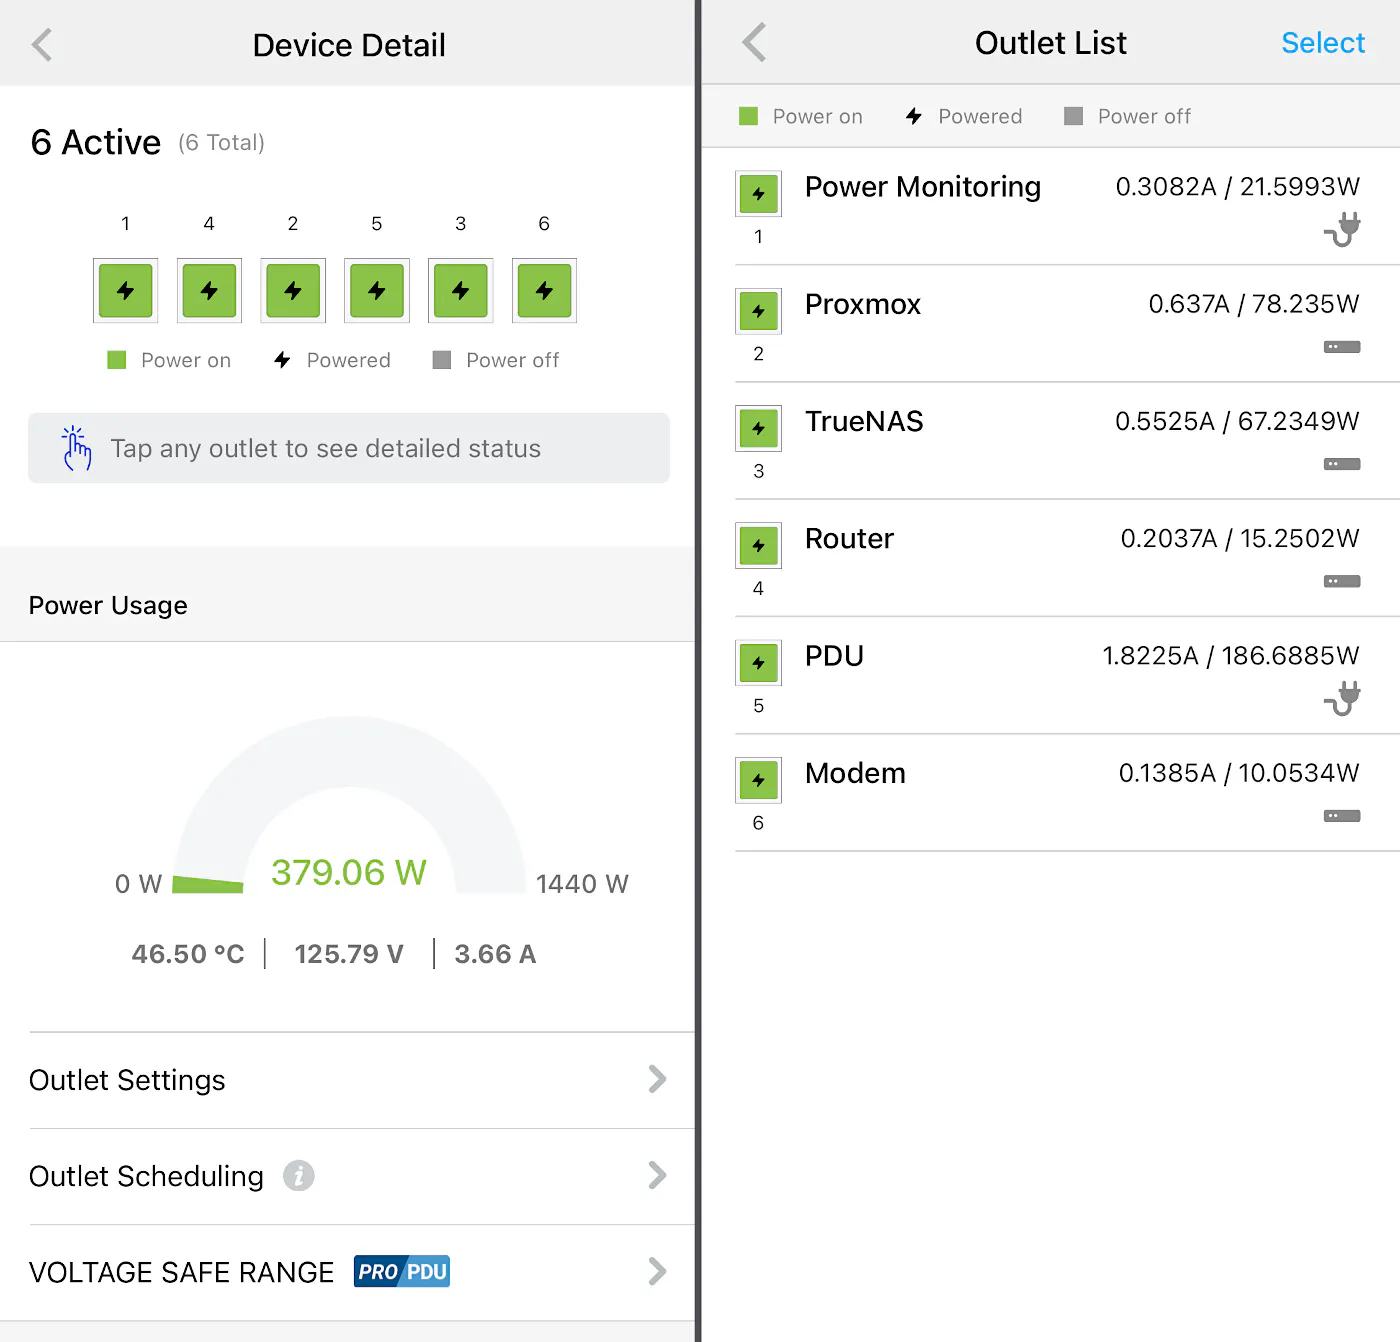
The mobile app only shows the power meter dial and the per outlet power values.
Multiple Mounting Options
The ECP106 comes with 2 sets of mounting hardware. One set is the standard rackmount ears, but the second set is essentially a 2U bracket. This provides you with a variety of options for mounting the PDU as well as including another 1U item such as a network switch.
A number of positions are shown below but there are more ways to mount than I have shown below. You can even use the standard rackmount ears to flush mount the PDU on a surface.
Front/top facing wall/surface mount:
On top of a surface:
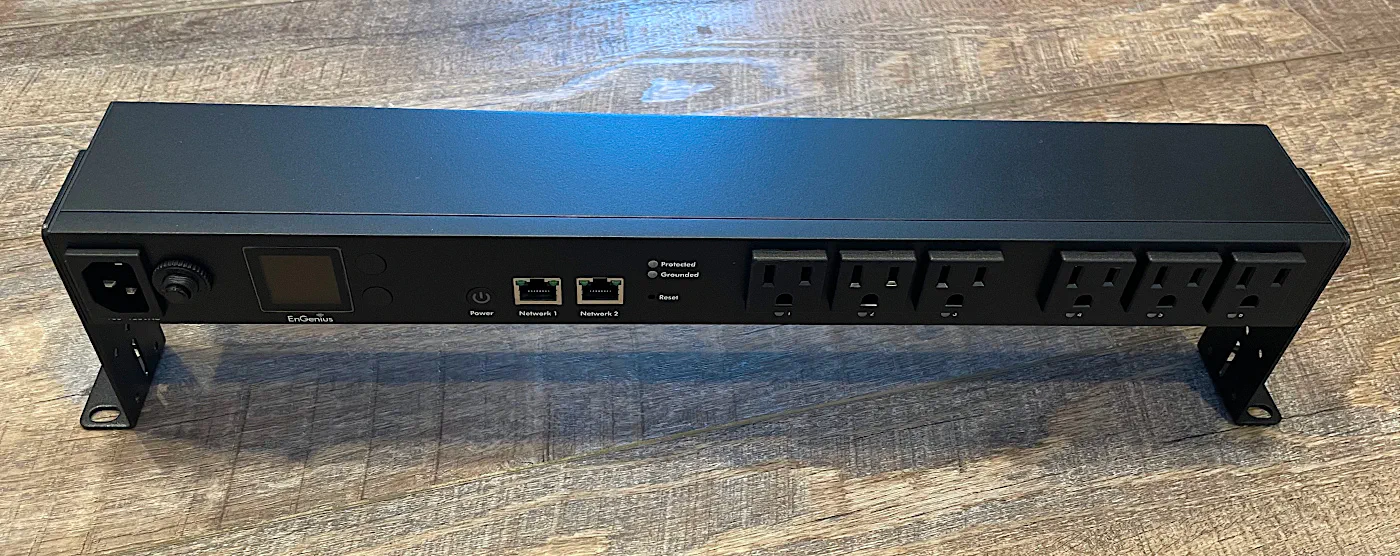
Underneath a surface:
Local and Cloud Management
The PDU can be managed by a local web interface or a cloud web interface. In addition, for cloud management EnGenius has their EnGenius Cloud to Go mobile app which you may use to monitor and manage your network remotely.
See the Management Interfaces section below for more information on each of the management interfaces.
Right Angle Outlets
Many rackmount PDUs have the outlets oriented along the width of the PDU so the outlets appear to be “sideways” in comparison to typical outlets on a wall, for instance.

However, my preference is to have “right angle” outlets on PDUs because of the convenience of plugging in devices which have large power transformers (affectionately known as “wall warts”). All of my “dumb” PDUs in my rack are right angle so I am happy to see that the EnGenius PDU is also designed that way.

In the image below, you can see the benefit of right angle outlets on a PDU. Without having a right angle outlet, the transformer would block multiple other outlets unless I plugged it into the far left or right outlet.
Out of all of my devices in my rack, I only have one device (my cable modem) which has a transformer which requires plugged in horizontally even with right angle outlets. The right angle orientation is better for most devices.
RESTful API
Devices which include a RESTful API are nice because you can programmatically control the devices via scripts or automation software. Unfortunately, the RESTful API is a Pro feature which you must pay $50 USD per year. You also gain the ability to create templates when you cloud manage the PDU.
For most home users, I imagine that yearly subscription would not be very appealing, but if you want to integrate your PDU into your home automations, having RESTful API access would most likely be very beneficial to you.
Management Interfaces
As mentioned earlier, you can manage the PDU via the local, standalone web interface or the cloud web interface.
You may only use one or the other because most of the configuration options will be disabled on the local web interface if you choose to cloud manage the PDU.
When you cloud manage the PDU, you may also use the EnGenius Cloud to Go mobile app. The app will receive push notifications when important events occur in your network such as when your EnGenius devices go offline or online.
Local Management Interface
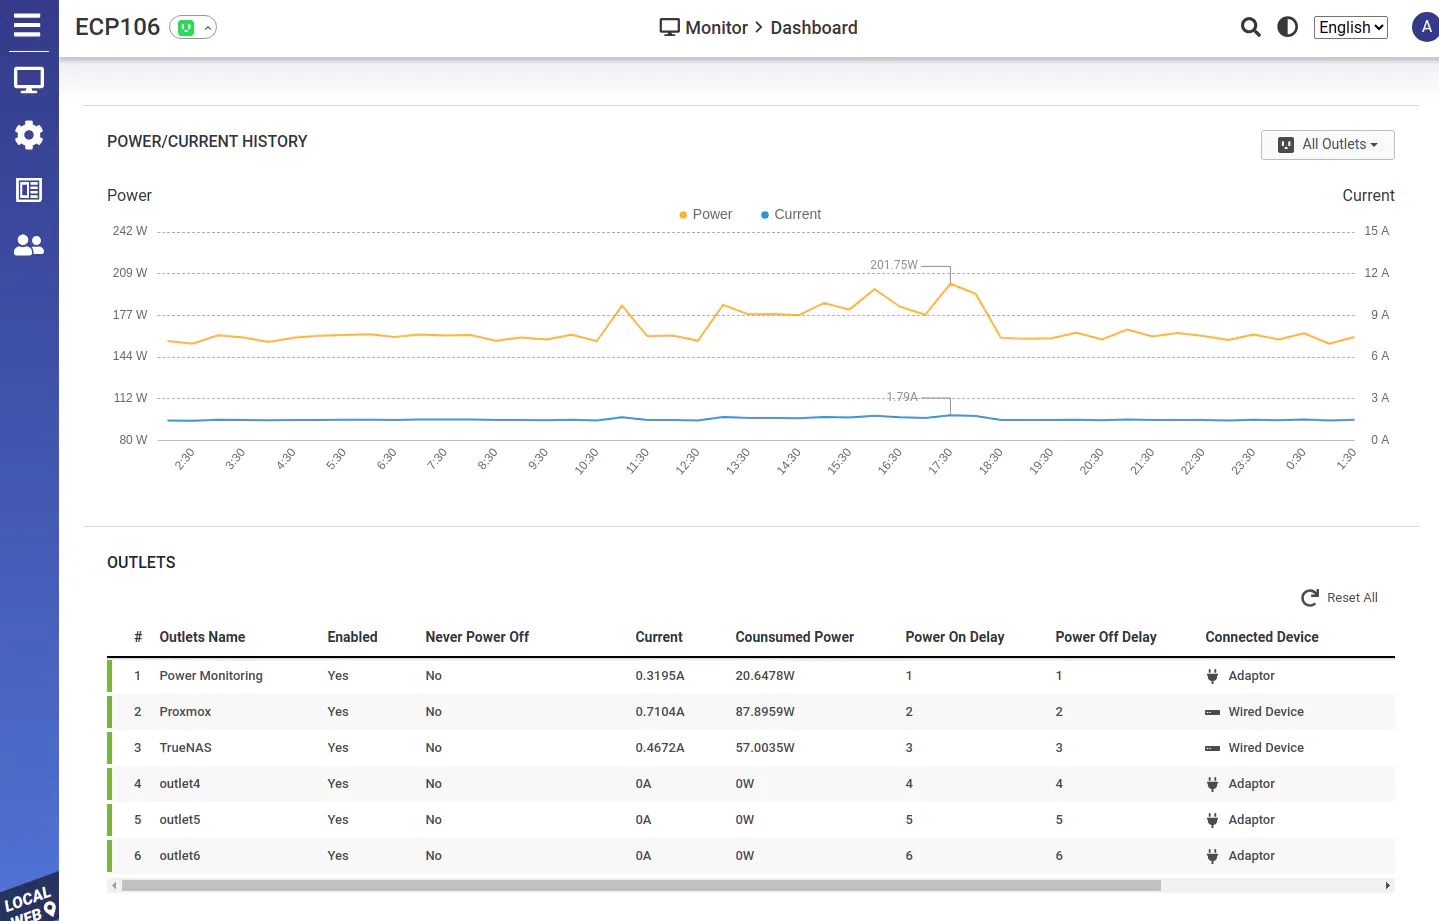
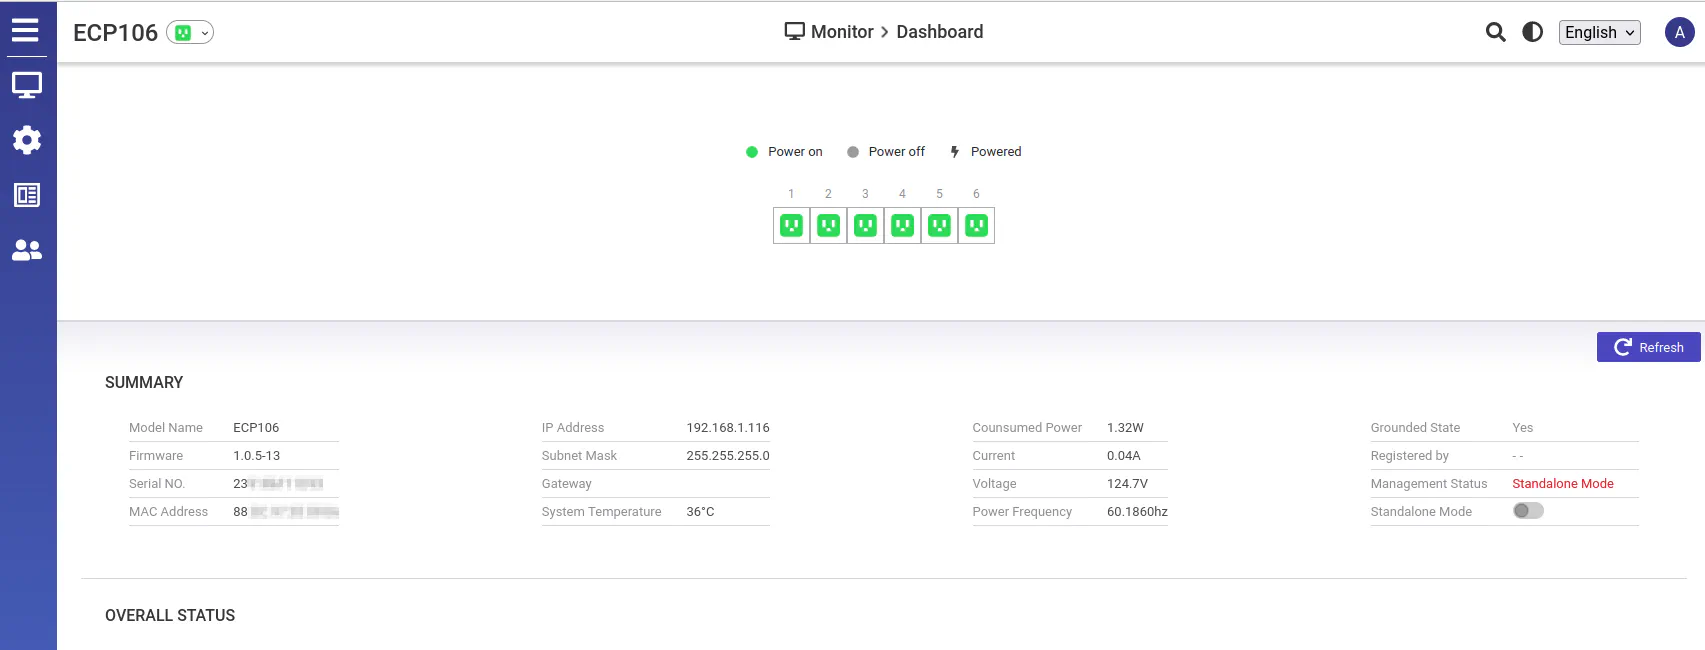
When you log in, you will be presented with the Dashboard which contains various information about the device at the top of the page. You will also see the overall power statistics of devices plugged into the PDU.
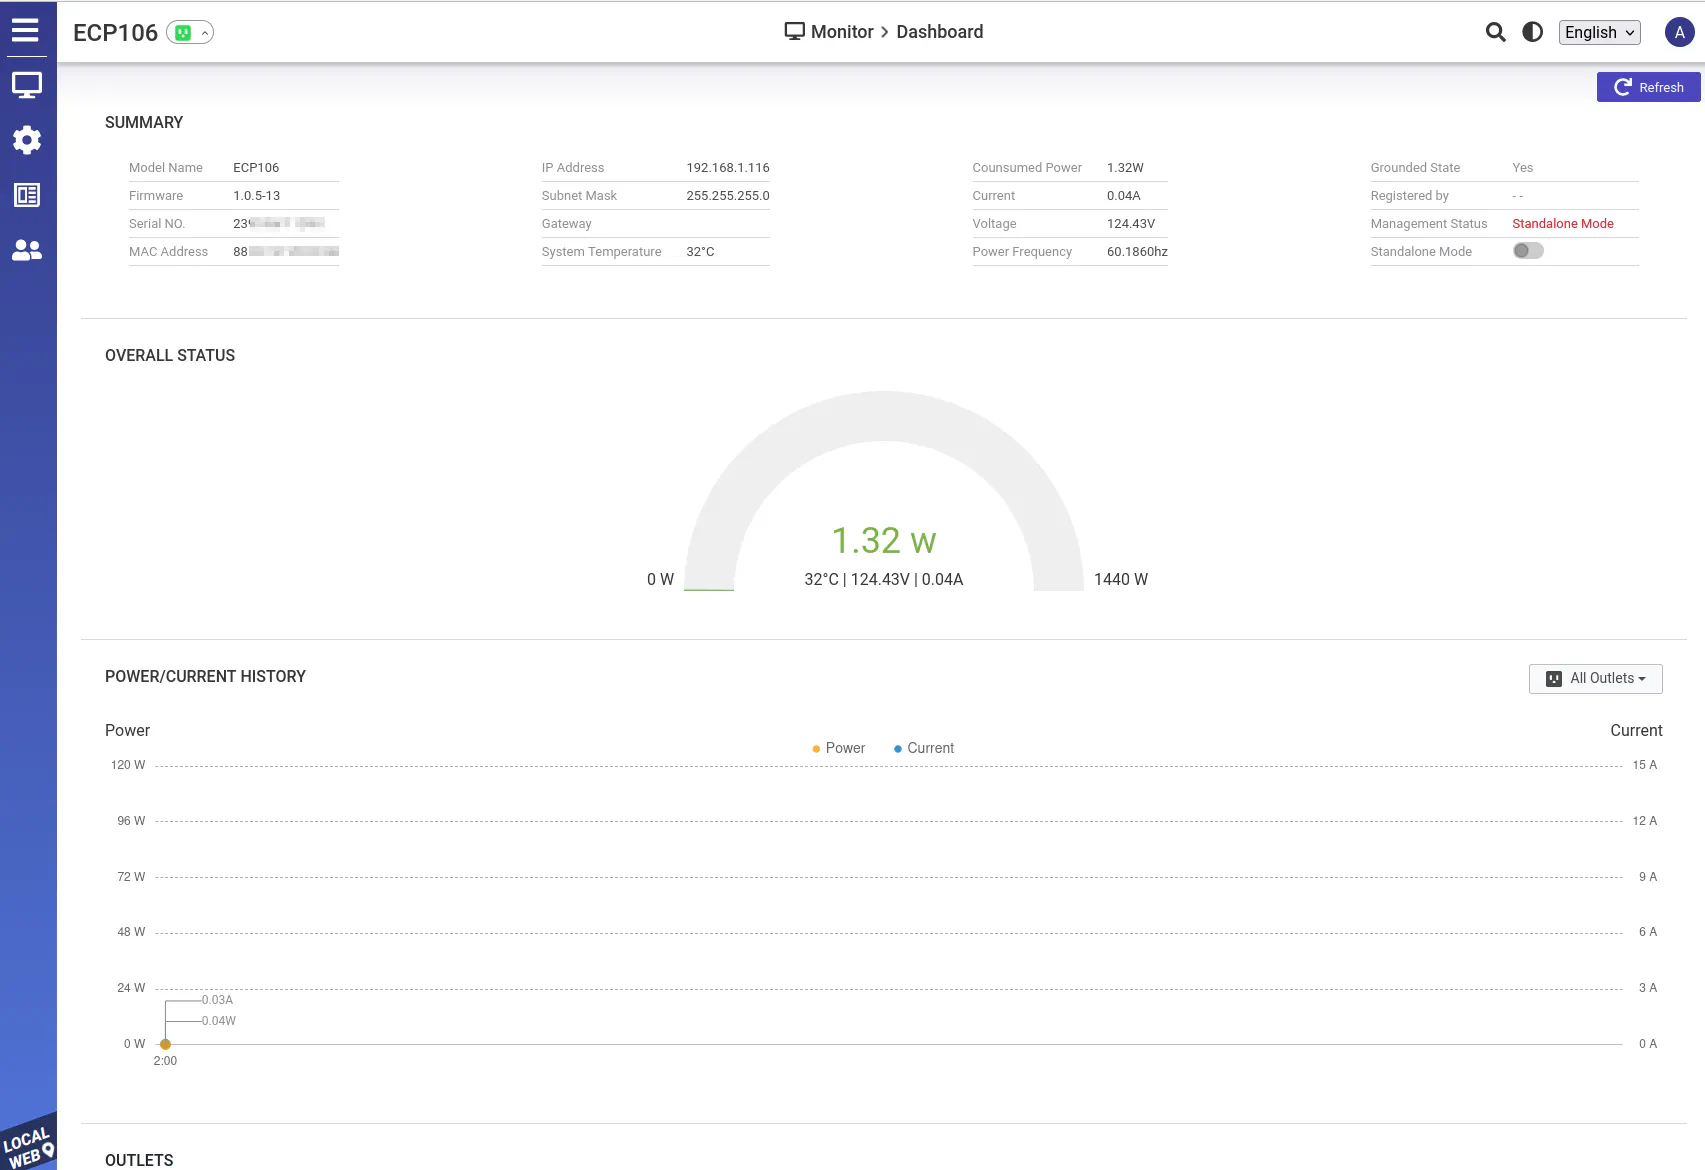
If you like dark mode, they have an option at the top of the page to switch to dark mode.
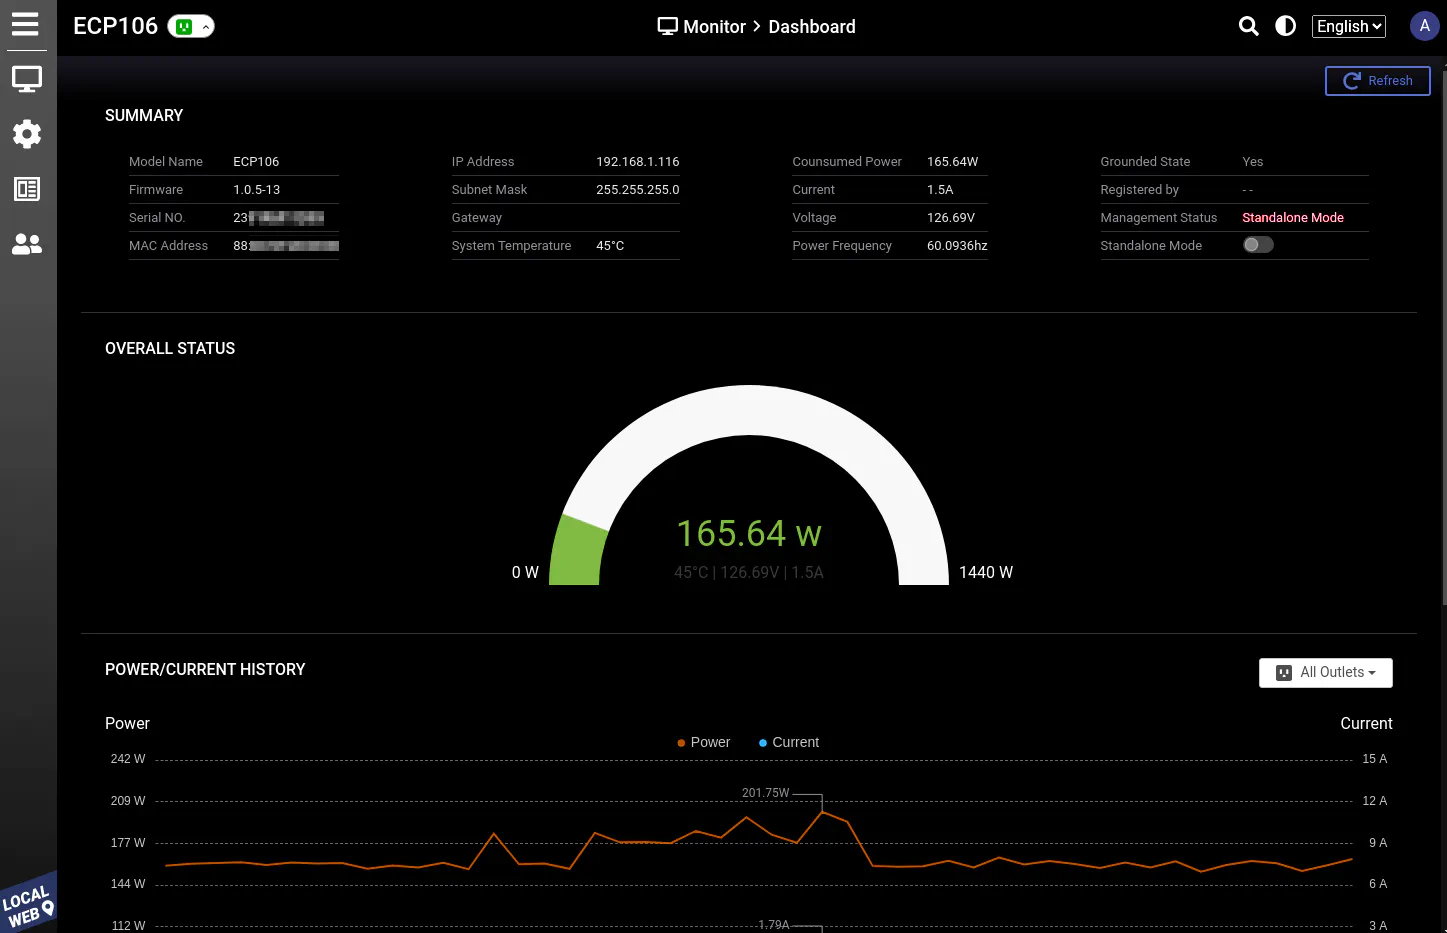
The power history is a nice graph that displays the highest wattage and amperage used in the last 24 hours. At the bottom of the page, the list of outlets are displayed along with the individual power usage and other configured options.
You will notice that you can name the outlets and select icons for each of the devices to help identify what is connected to the PDU. That is essential if you wish to remotely control the PDU so you know which devices you would like to turn on/off, etc.
If you click on the dropdown beside the “ECP106” on the top bar, you will see a quick overview of the outlets to see which ones are powered on.
The “System Information” page allows you to change the “Device Name” and “Location” of the PDU.

By default, the PDU is set to use DHCP but you can change the setting on the “IP Addressing” page. Many users like to set static IPs for critical network infrastructure so if the DHCP server is down, you can still access the devices without worrying about the possibility of DHCP leases expiring.

You may change the system time on the “System Time” page. You may set a different “Time Zone” and “NTP Server Address” if you like.

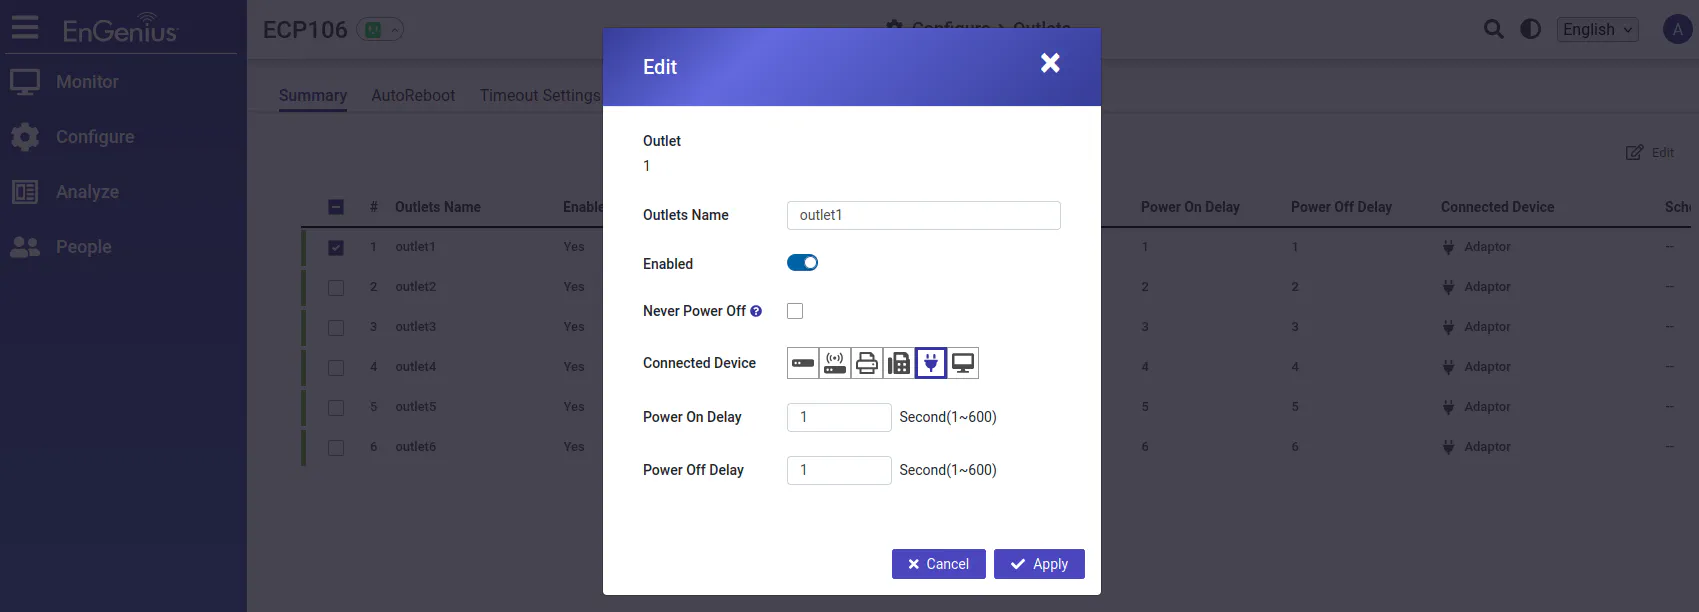
On the “Configure > Outlets > Summary” page, you may vew the various settings per outlet such as the “Outlet Name”, whether it is “Enabled” or not, and “Power On/Off Delay”.

The “Edit” dialog box for the outlet allows you to change the settings for each outlet.
The “Autoreboot” page is where you can configure the outlets to “reboot” (turn off and back on) whenever a certain IP/hostname is no longer able to be reached. This may be useful for home users to reboot their modems if the Internet goes down. Some connectivity issues can be resolved by a simple reboot so it is nice to have this functionality to help bring the network or other devices back up.

If you enable the autoreboot functionality, you can further configure the options on the “Timeout Settings” page. There you can set the interval between pings for the IP/hostname you entered for the autoreboot option as well as how long to wait in between reboots. Finally, you can specify the total number of reboot attempts.

Outlets may be configured on schedules so you can power them on/off during specific times. You may only set one schedule per day for each outlet.

There is a page for firmware updates if you wish to do it manually but if you cloud manage the PDU, firmware updates may happen automatically so you would not need to manually upload firmware files unless auto updates are turned off.

For those who use SNMP to monitor their network infrastructure, the ECP106 has options for that type of monitoring.

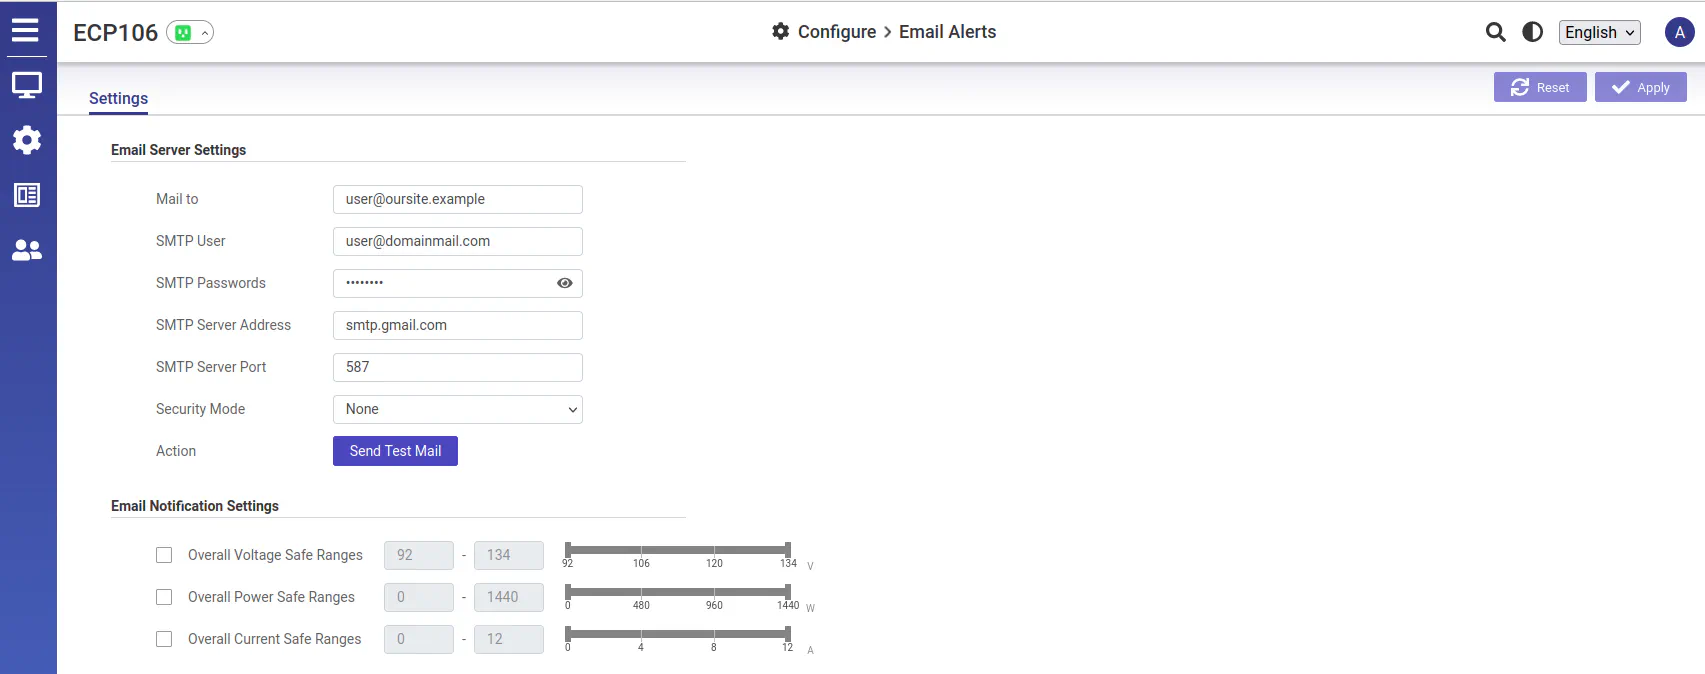
Email alerts are nice to have when you want to be notified when power usage is out of normal parameters. I like having this feature because it helps bring attention to potential safety concerns you may need to address before it becomes a bigger and more dangerous problem.
You may view logs produced by the PDU on the “Analyze > Logs” page.

If you need to download the logs for further analyzing, you may do that on the “System Logs” page.

To help centralize logging for network infrastructure, you may send reporting data to a Syslog server.

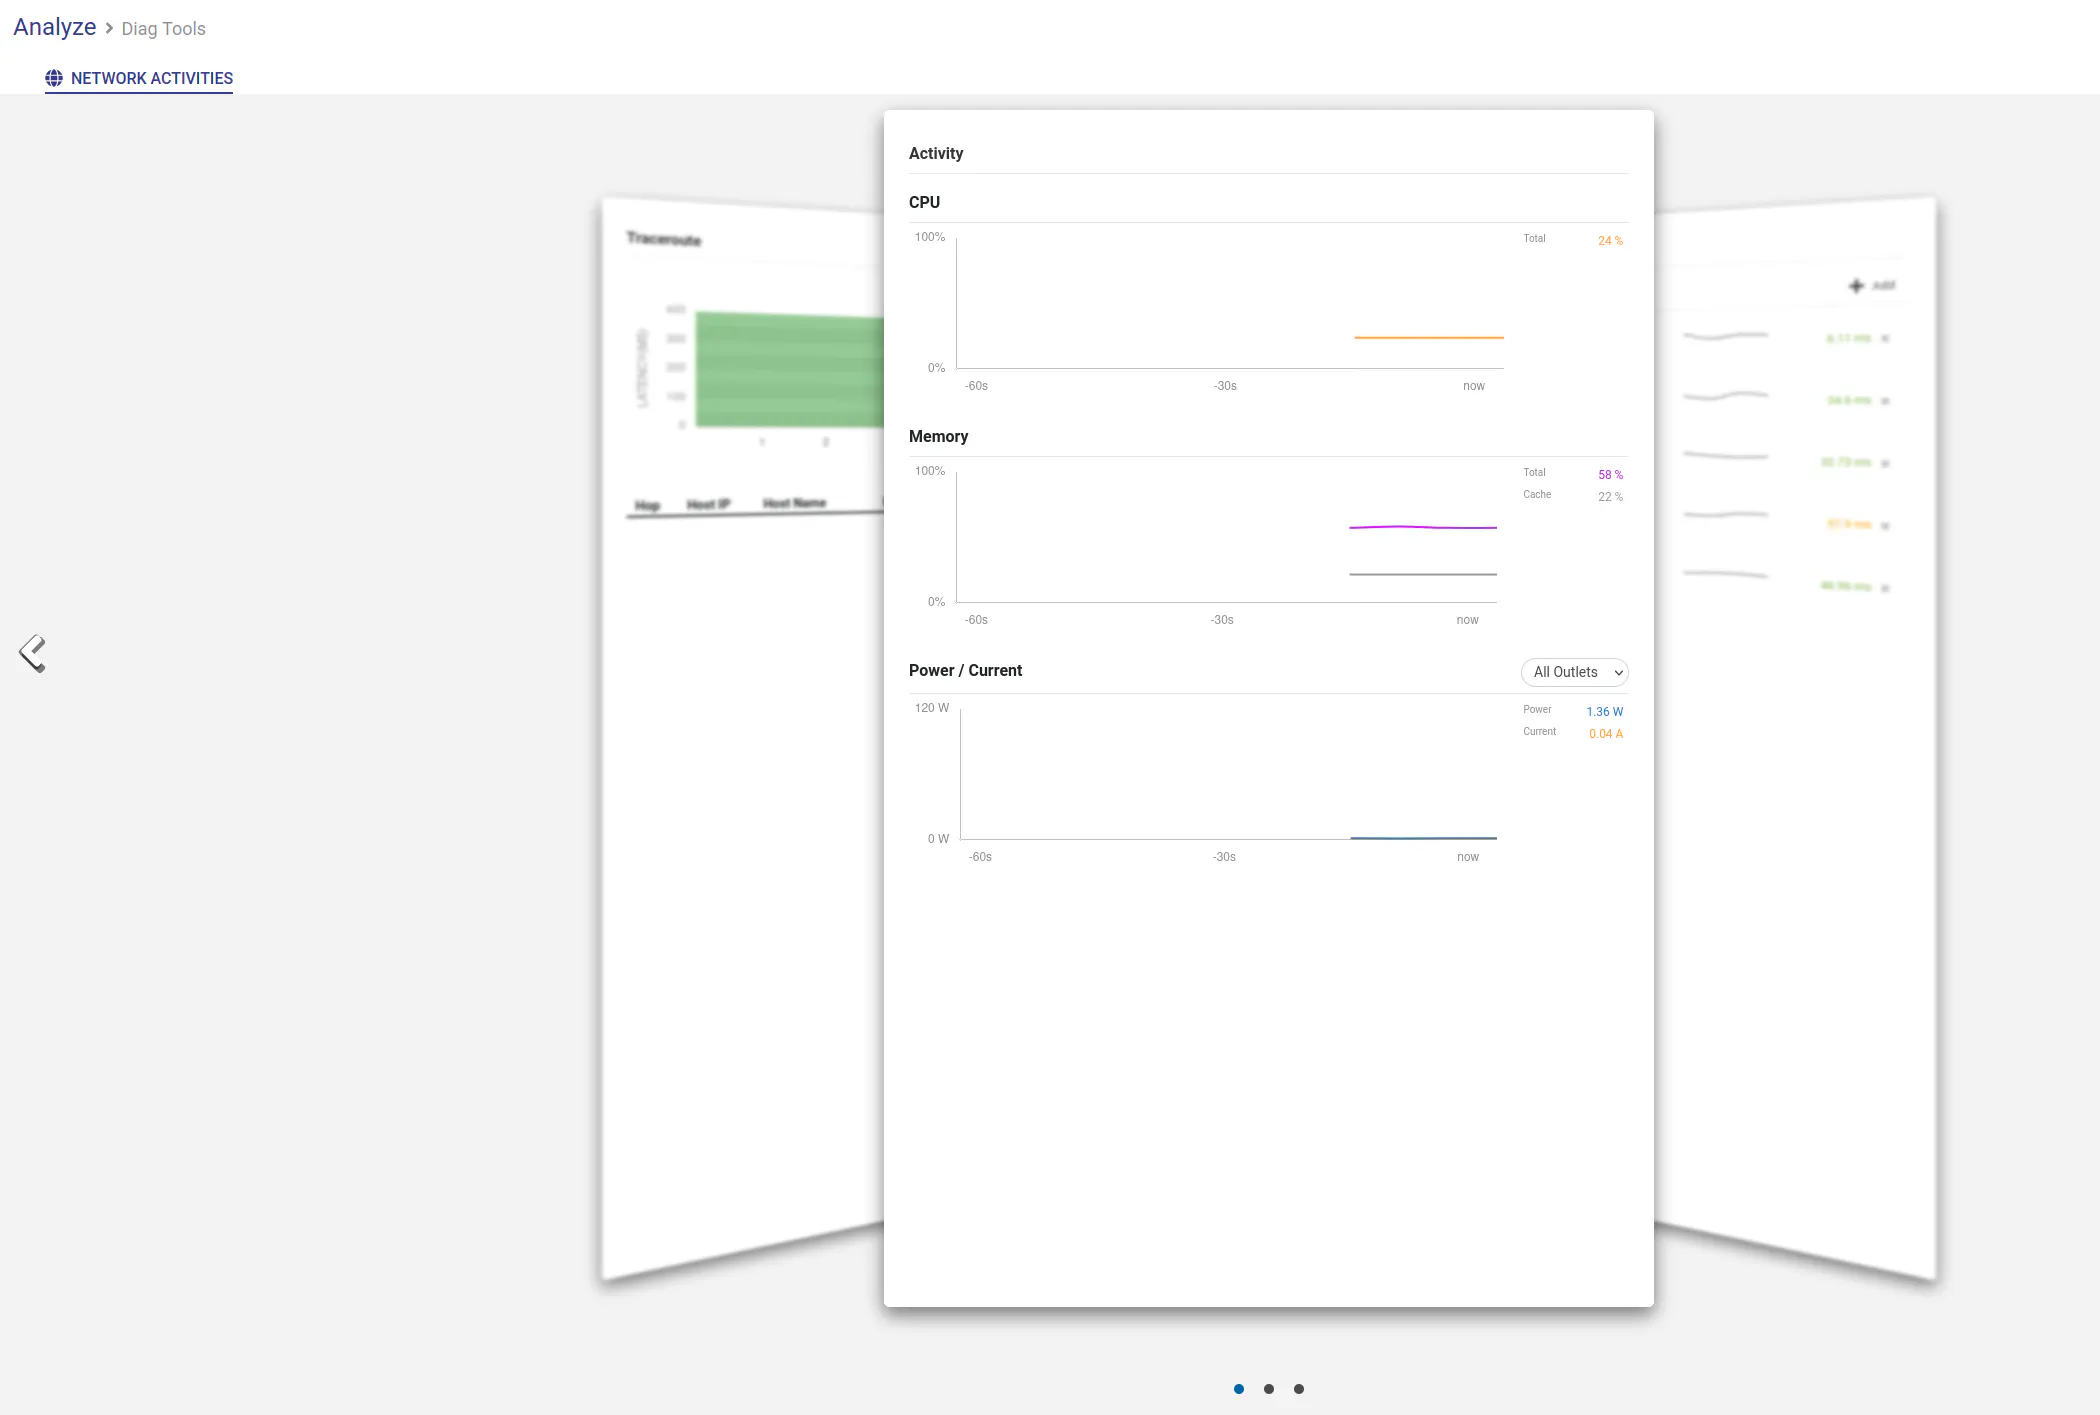
There are diagnostics tools on the “Analyze > Diag Tools” page. This is similar to the EnGenius network switches, but there are fewer tools included since the PDU has less functionality than the network switches (which means there is less diagnostics needed).
The diagnostics tools opens full screen in the browser so you can focus on the various tools that you can flip through.
You may configure various users to have access to the PDU on the “People” page. This is also available on the cloud managed interface but the users can apply across multiple devices rather than each individual device.

Cloud Management Interface
The cloud management interface is designed a bit differently than the standalone web interface because it supports configuring multiple EnGenius devices. I did not include a screenshot of the cloud management dashboard because the PDU counts are not included with the gateway/switch/AP counts.
If you navigate to the “Manage > PDUs” page, you will see the list of PDUs you have added to your cloud account.

If you click anywhere on the PDU row, you will see the outlet view displayed below the row. This gives you a quick glance of the power status of the outlets and the power statistics per outlet.
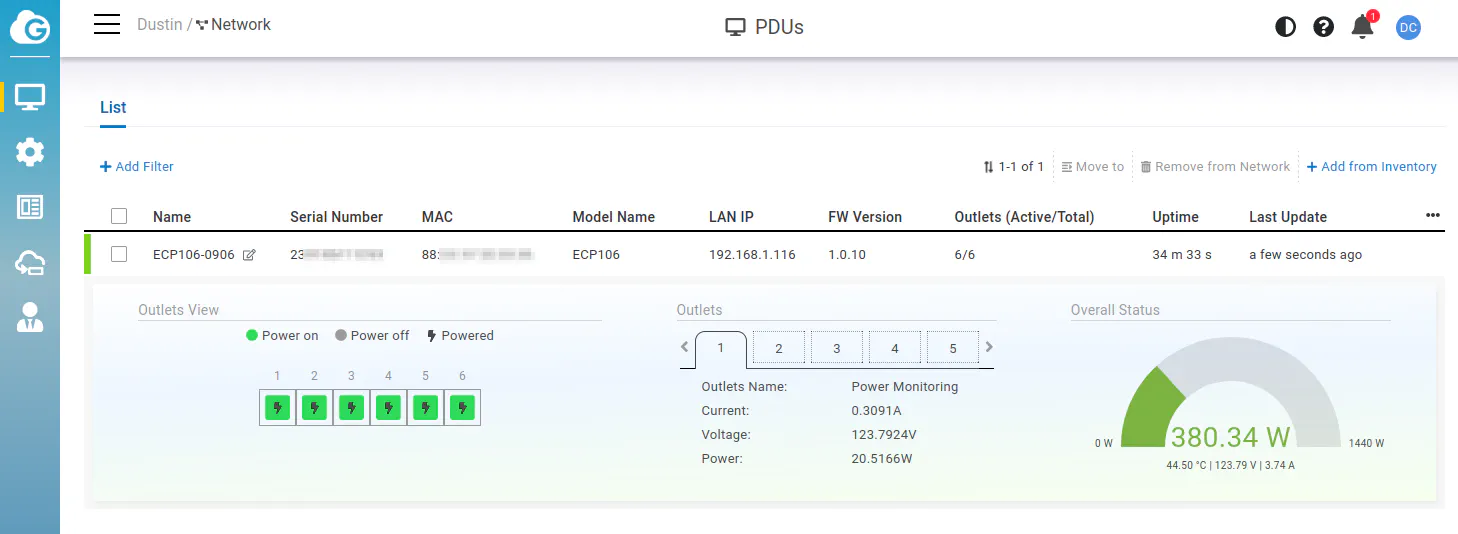
When you hover over the PDU row instead of clicking on the row, you will see additional options appear on the right hand side of the row.

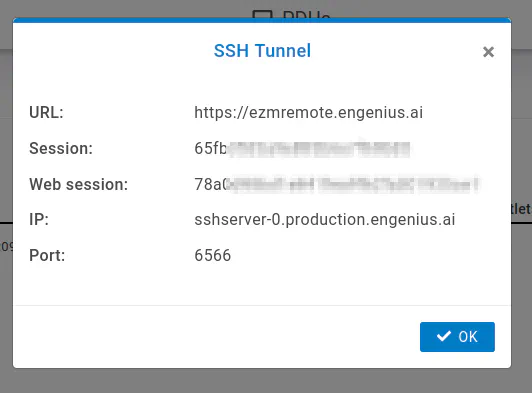
The far right option is the “SSH Connect” option which provides you a way to SSH into your device without needing to open up any firewall ports since you connect through their cloud servers.
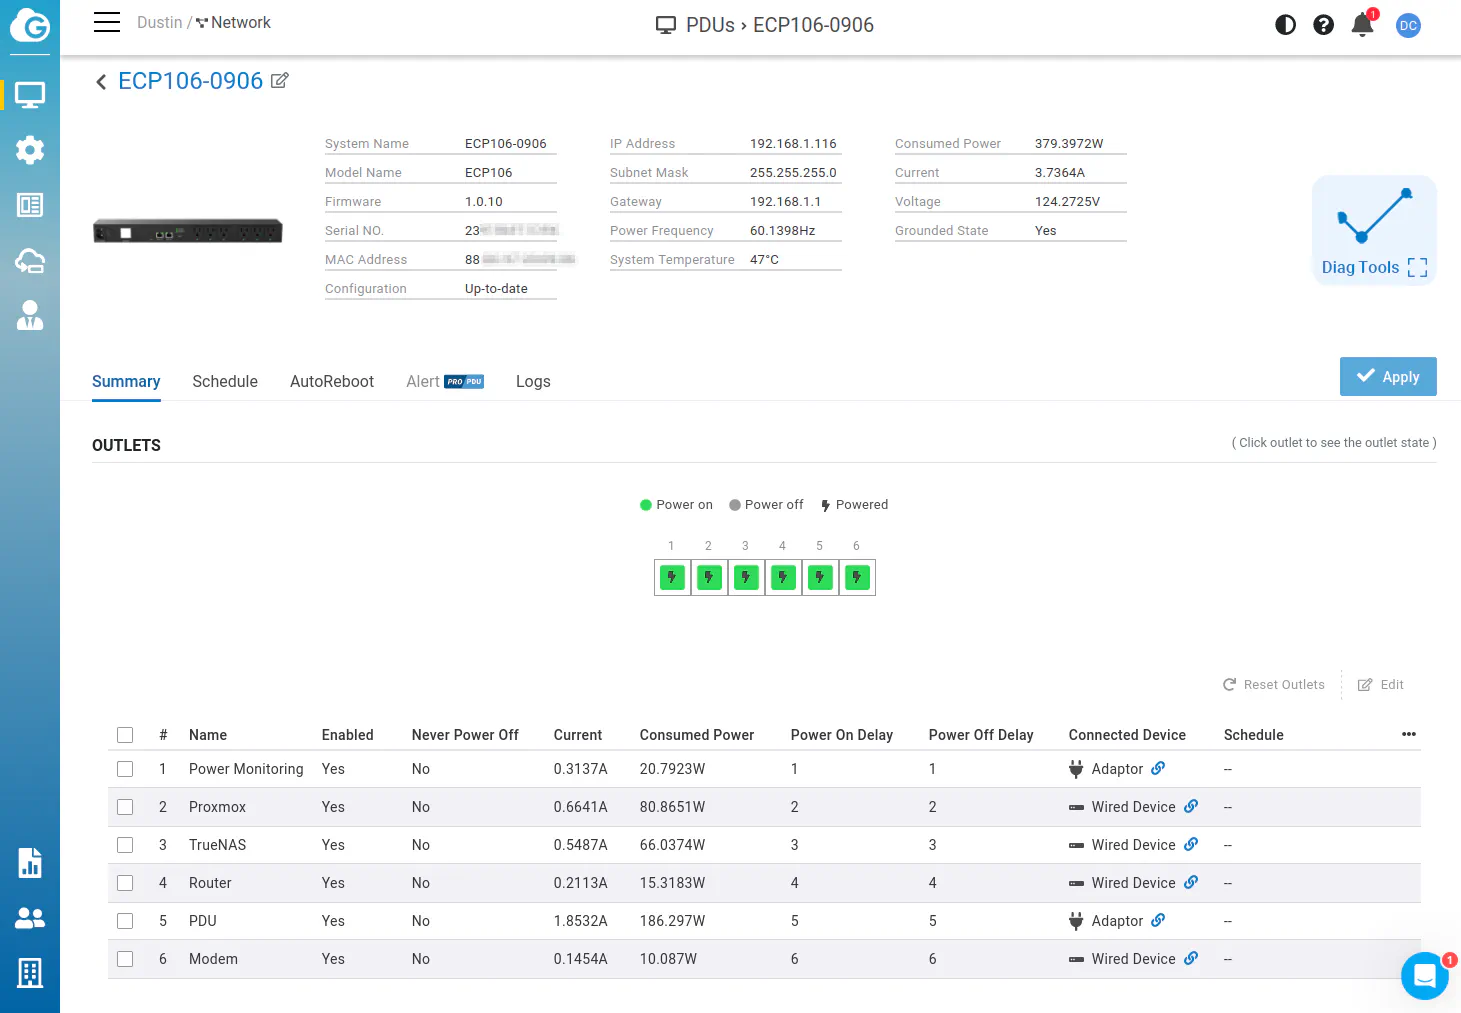
If you click on the “Details” link when you hover on the row of the PDU, you can view information about the PDU and also have the ability to configure the PDU on different tabs. For instance, the “Summary” tab is similar to the standalone web interface where you can name outlets and modify other settings for each outlet.
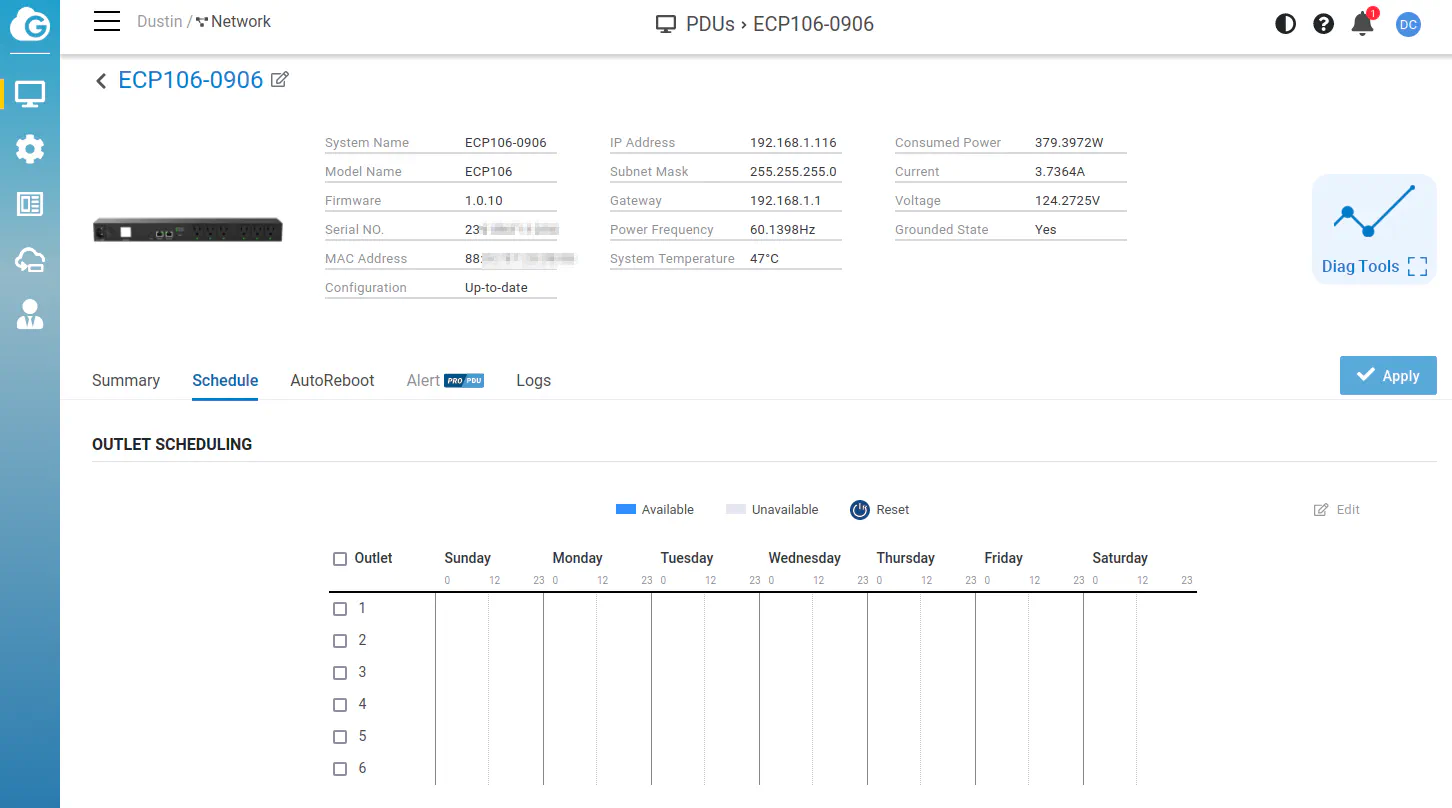
On the “Schedules” tab, you can set the schedules for each outlet.
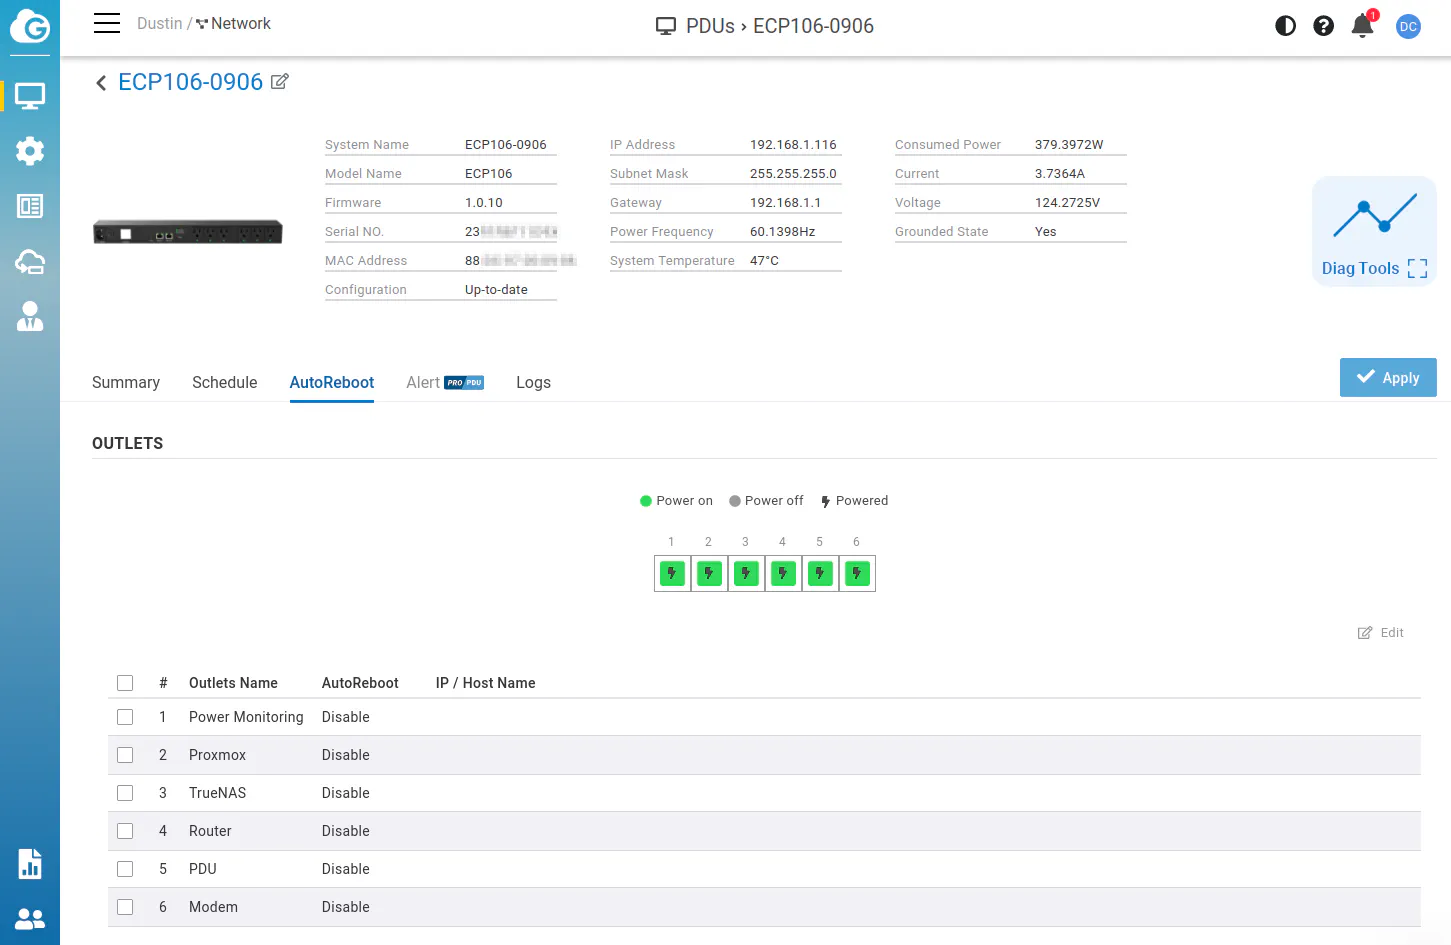
The autoreboot functionality can be enabled on the “AutoReboot” tab.
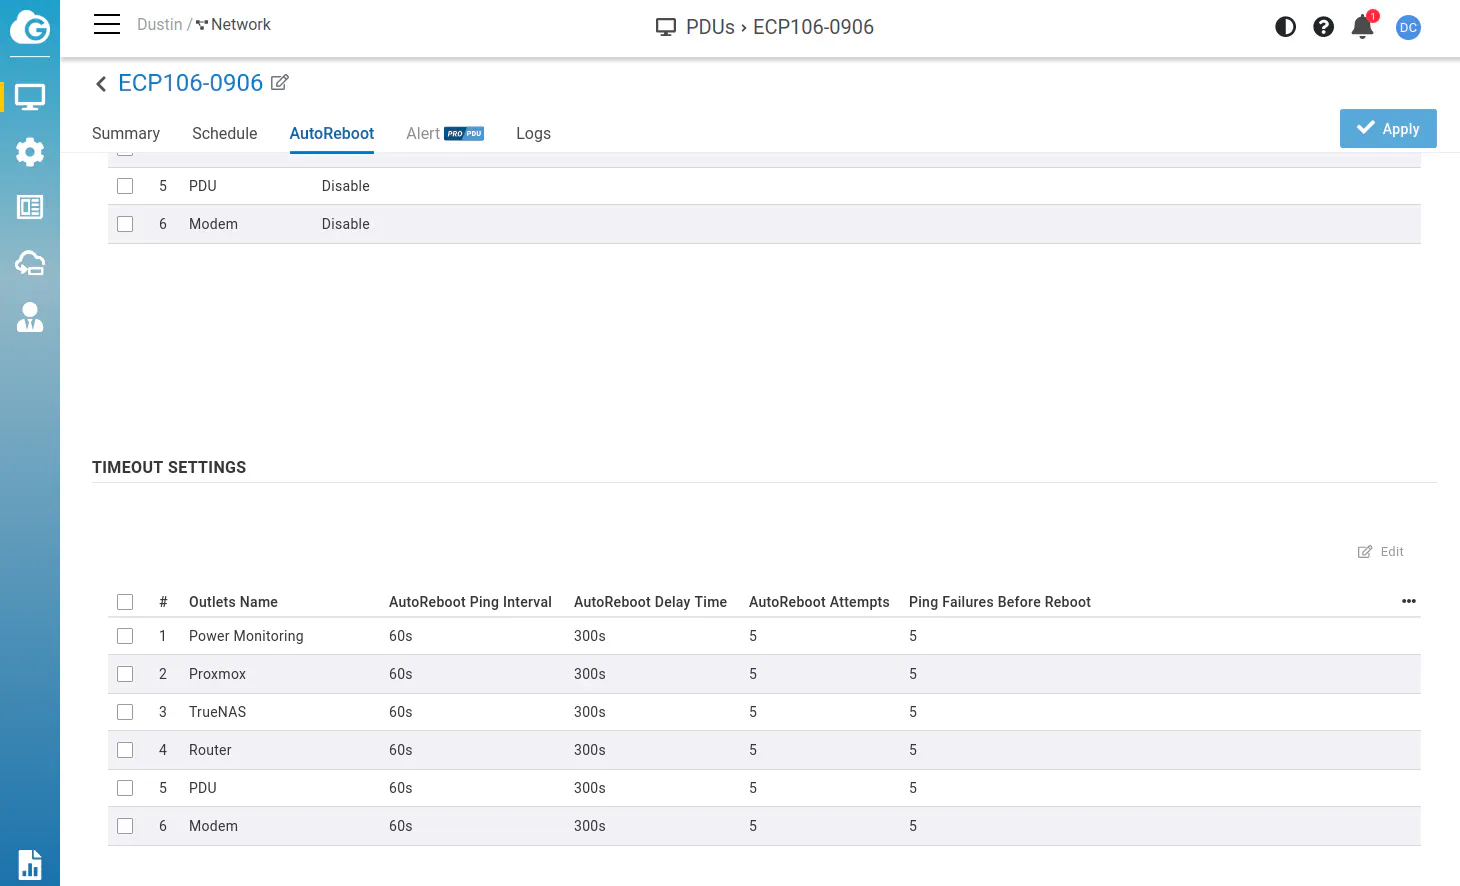
For the timeout settings of the autoreboot functionality, you need to scroll down the page further to modify those settings. I like the timeout settings are on the same page as the autoreboot settings unlike the standalone web interface because it is a little bit confusing when you new to configuring the PDU.
Notice that the “Alerts” tab is locked behind the Pro license, which I thought was interesting because when using the PDU in standalone mode, email alerts may be configured. However, on the cloud, you need a license. I am guessing that is because you could receive notifications on the Cloud to Go mobile app which EnGenius considers a premium feature. Perhaps there are other alert settings not available in standalone mode.
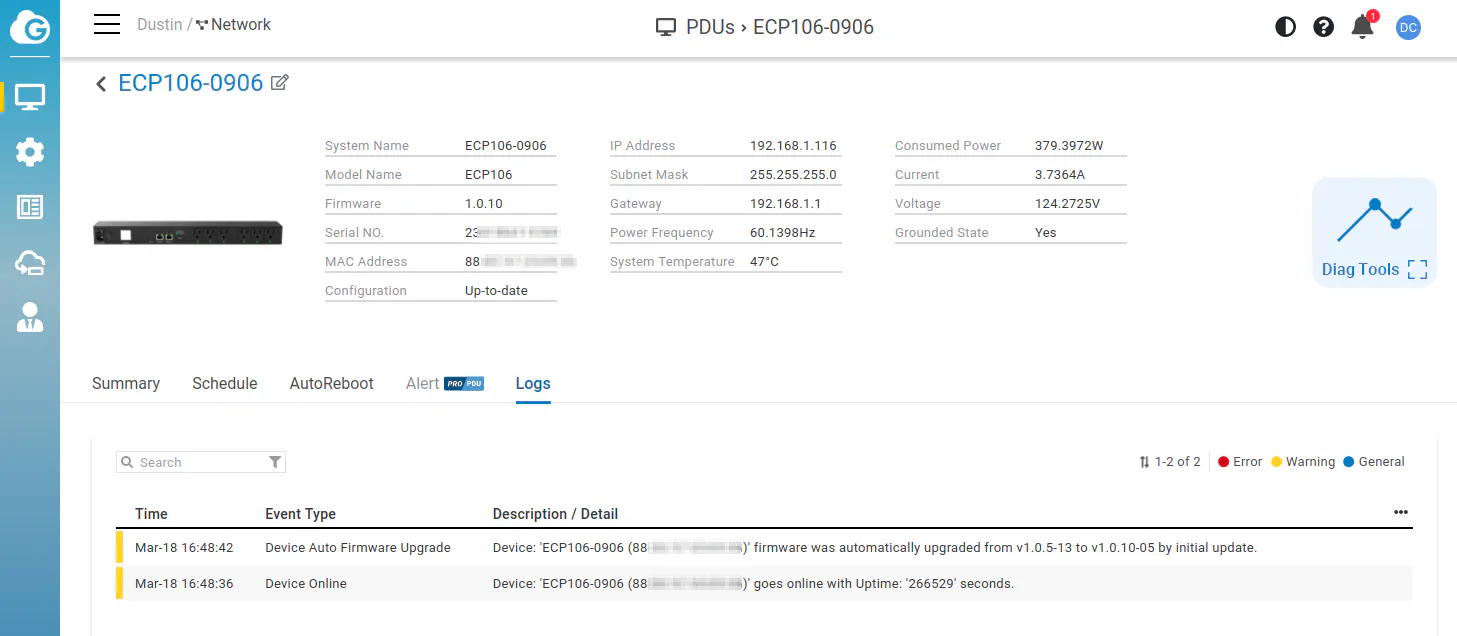
On the “Logs” tab, you can see the PDU logs if you need to troubleshoot any issues or view events that have occurred.
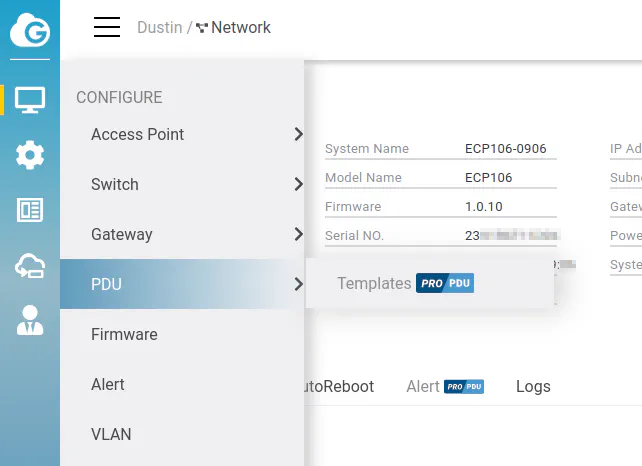
Another Pro feature is PDU “Templates”. My guess is that it allows you to create templates that may be used if you have multiple PDUs in your server rack(s). You may wish to set similar schedules and other settings without needing to set them manually for each outlet on each PDU.
Where to Buy?
The EnGenius ECP106 PDU is sold by a number of distributors, which may be found on the EnGenius website.
Note that I do not earn affiliate commission if you use the link above.
